You are viewing 1 of your 1 free articles
MHCLG’s net new homes figure jumps to highest point in 30 years
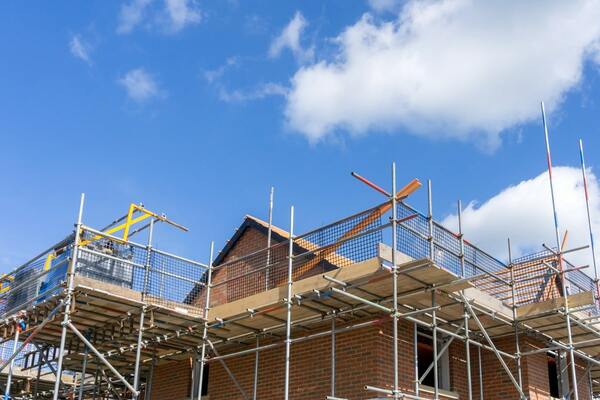
The number of net additional homes delivered annually in England has risen to it highest point in nearly 30 years, according to new official figures.
A total of 241,130 net additional homes were recorded in the year to March 2019, a rise of 9% on the previous year, the Ministry of Housing, Communities and Local Government (MHGLG) revealed today.
The new figure is larger than the previous high of 223,530 delivered in 2007/08 prior to the financial crash. It is also the highest number since records began in 1991/92.
It means the government is on track to meet its target of a million new homes between 2015 and 2020.
However, it is still well below the government’s current target of delivering 300,000 homes a year by the mid-2020s.
The latest figures broken down consisted of 213,660 new builds, 29,260 gains from change of use between non-domestic and residential, 5,220 via house-to-flat conversions, and 940 other gains, such as caravans and house boats etc. This was offset by 7,940 demolitions.
A total of 14,107 of the net additions from change of use were through permitted development rights, where full planning permission was not required.
The net additional dwelling figures are based on local authority estimates of gains and losses of dwellings during each year, according to MHCLG.
The statistics do not provide a breakdown by tenure, but MHCLG claims they are “the most comprehensive measure of housing supply”.
Other figures covering this area are published by the National Housing Federation and National House Building Council, which has previously caused confusion over the real picture on housing delivery.

