You are viewing 1 of your 1 free articles
Housing sector diversity: has the needle moved?
The National Housing Federation today publishes its second set of diversity data. Jess McCabe digs through the numbers to find out if the sector has become any more representative since 2021
Diversity in the housing sector has been the subject of conferences, events, a Chartered Institute of Housing presidential campaign – and, not least, a significant number of stories in Inside Housing. But has all this discussion and effort moved the needle?
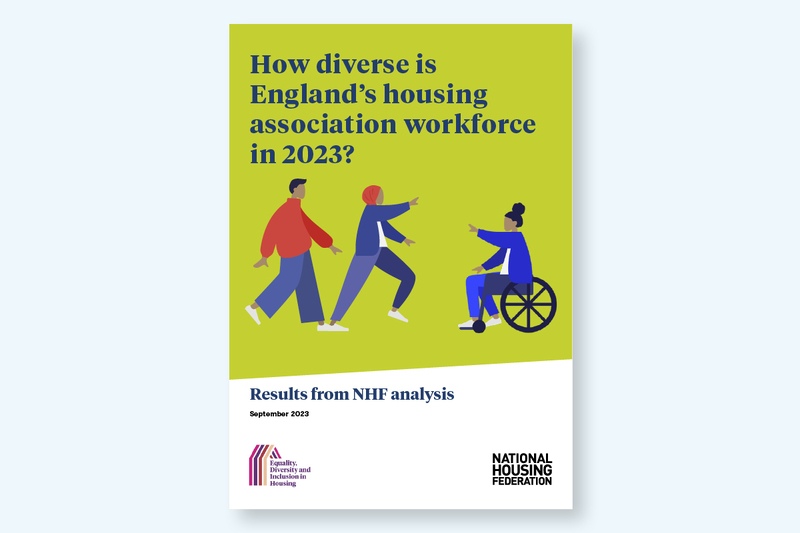
We can get our first inkling of that now, because the National Housing Federation (NHF) has published the results of its second major data-gathering exercise on the diversity of England’s housing workforce, executives and board members.
The equality, diversity and inclusion (EDI) data tool includes information from 177 housing associations and two ALMOs, covering their staff, executives and board members. And, as it is the second report from the EDI tool, we can start to measure progress.
The most stark finding is on disability. The disparity is stark – 29% of social renters are disabled. More broadly, 24% of the population is disabled, and 16% of people in employment. But only 9% of the sector’s workforce is disabled, only 6% of executives and 10% of board members. The percentage of executives who are disabled dropped from 2021, when the NHF published its first EDI data tool results, to 2023 – from 8% to 6%.
“Progress requires both internal engagement with disabled members of staff, to understand barriers and the effectiveness of any actions already in place, and external engagement, seeking advice and support from experts and sharing learning as a sector,” the report says.
Lack of progress
On ethnicity, the figures are disappointingly static. While the workforce is broadly representative of the population, executives and board members are not, with no real change since 2021. “Those in leadership positions are not representative of the workforce or communities in terms of ethnicity, with no progress over the past two years,” the report says. “As we found when we first undertook this exercise in 2021, our executive teams are significantly less ethnically diverse. Only 4% of executives are either Black/African/Caribbean/Black British or Asian/Asian British compared to 14% of the population.”
In numbers
29%
Percentage of social renters who are disabled
4%
Proportion of executives who are Black/African/Caribbean/Black British or Asian/Asian British
Many of the figures remain unchanged: 90% of executive positions are still filled by white people, and 8% of board members are Asian/Asian British, the same in 2021 and in 2023. “The only notable difference is that there has been a decrease from 8% to 6% in the proportion of board members who are Black/African/Caribbean/Black British, and a corresponding increase in the proportion of board members who are white,” the report found.
The NHF’s next project is going to be its ‘Knowing Our Homes’ review. This will take data a step further: beyond looking at how representative the workforce and leadership of the sector is, it will “identify if and where residents from certain groups, including residents from Black, Asian and minority ethnic backgrounds, are more likely to live in poorer-quality homes”.
Representation of women has tracked up slightly in leadership roles – although men are still over-represented. Women’s representation in executive roles has risen from 45% to 47%, and among board members from 42% to 44%. Women make up 54% of the workforce.
But there are big gaps remaining in the data – particularly regarding gender identity, sexuality and religion. On gender identity, around half the data is missing. Looking at the associations that did provide data shows that there are no executives or board members who are transgender.
The report found that 5.3% of executives are gay or lesbian, compared to 1.9% of the population, although slightly fewer are bisexual than the general population. “Some of this difference may be explained by the fact that 6% of the workforce, and 5% of executives and board members, have chosen not to disclose their sexual orientation. Underreporting may also be a factor in data on the sexual orientation of the population as 7.8% did not respond to the question on the 2021 Census,” the report says.
The NHF struggled most to collect data on socioeconomic background. The EDI data tool asks for information for staff, executives and board members on their parental occupation when they were 14, whether they attended private school and if they were eligible for free school meals. It also asks about caring responsibilities – if they have dependent children or provide informal care. The hole in the data here is enormous.
“Progress requires both internal engagement with disabled members of staff, to understand barriers and the effectiveness of any actions already in place, and external engagement, seeking advice and support from experts and sharing learning in the sector”
“We are missing over 90% of data on all these characteristics for the workforce,” the report says. “Knowing the socioeconomic background of our sector’s workforce helps us to understand how well the sector supports social mobility and socioeconomic diversity, which is particularly important given our role in providing homes for people on lower incomes,” it adds.
The NHF is working on how to close some of these gaps – for example, supporting housing associations to collect this data separately from their normal equalities data, in an anonymous format that might encourage more people to supply the information and build trust on how it will be used.
Sign up for our daily newsletter
Already have an account? Click here to manage your newsletters


