You are viewing 1 of your 1 free articles
Housing’s gender pay gap problem: find data for 47 associations
Last year, major employers for the first time had to reveal details of their gender pay gaps. Now, with a second set of figures published, Kate Youde finds that housing has a long way to go to achieve parity
Housing associations had until last week to disclose their second set of gender pay gap figures to the government. The reporting process is meant to help reduce differences between men and women’s pay, so what progress has the sector made?
Under legislation introduced in 2017, businesses and charities with 250 or more employees have to report the difference in average hourly earnings and bonus payments for men and women. This is not to be confused with (unlawful) unequal pay, which relates to paying men and women differently for the same or similar work.
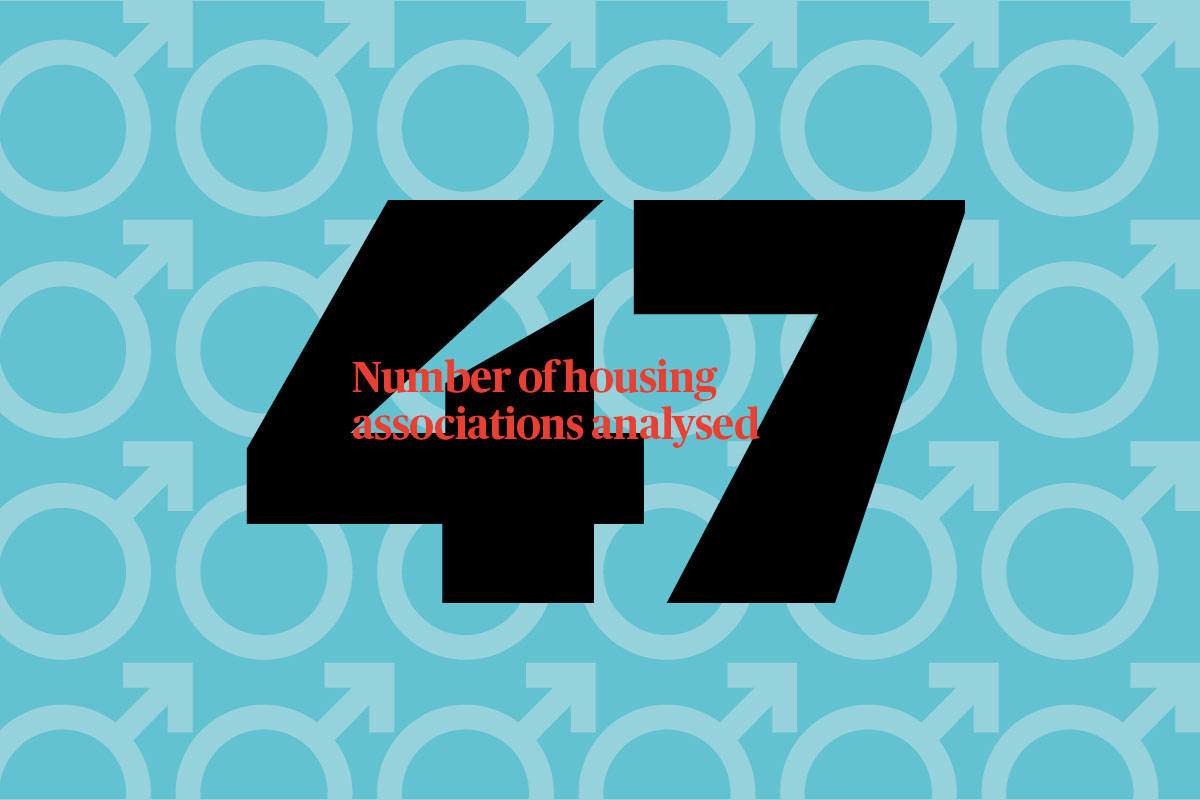
Last year, Inside Housing analysed the figures for 50 associations. Following mergers, this same sample is now 47 organisations. Of these 47, three are reporting figures for their new entity for the first time, meaning no direct year-on-year comparison is possible.
“[Women] will suggest something and it will be glossed over, and a guy will suggest the same thing and he’ll almost get a high-five off someone”
Halton Housing Trust is not included in these results. According to the government gender pay gap portal, it is “not required to report” its 2018 figures. However a spokesperson for the association, which says in its own report that it has a median gender pay gap of 11.6% in favour of women, said the organisation had submitted figures to the government website and has logged the matter with the web team for investigation.
At more than half of the remaining associations (22 out of 43), the median gender pay gap – the difference between the hourly pay of the middle-ranking woman and the middle-ranking man in an organisation – widened in favour of men between April 2017 and April 2018. There was no change at a further three associations, including Choices Housing Association, where the gap was zero.
Your Housing Group recorded one of the largest improvements in percentage points, narrowing its median gender pay gap from 15.6% to 8.2%. The 30,000-home association actively sought its employees’ help to address its pay gap, and the anecdotal feedback suggests that women are often not being heard.
“They will suggest something and it will be glossed over, and a guy will suggest the same thing and he’ll almost get a high-five off someone,” says Stephen Joyce, director of human resources at Your Housing Group.
Overall, 10 associations narrowed their gap, but still paid men more. Three organisations, which had pay gaps favouring men last year, now pay women more than men, and a further three continue to have a pay gap favouring women. Two associations eliminated a pay gap.
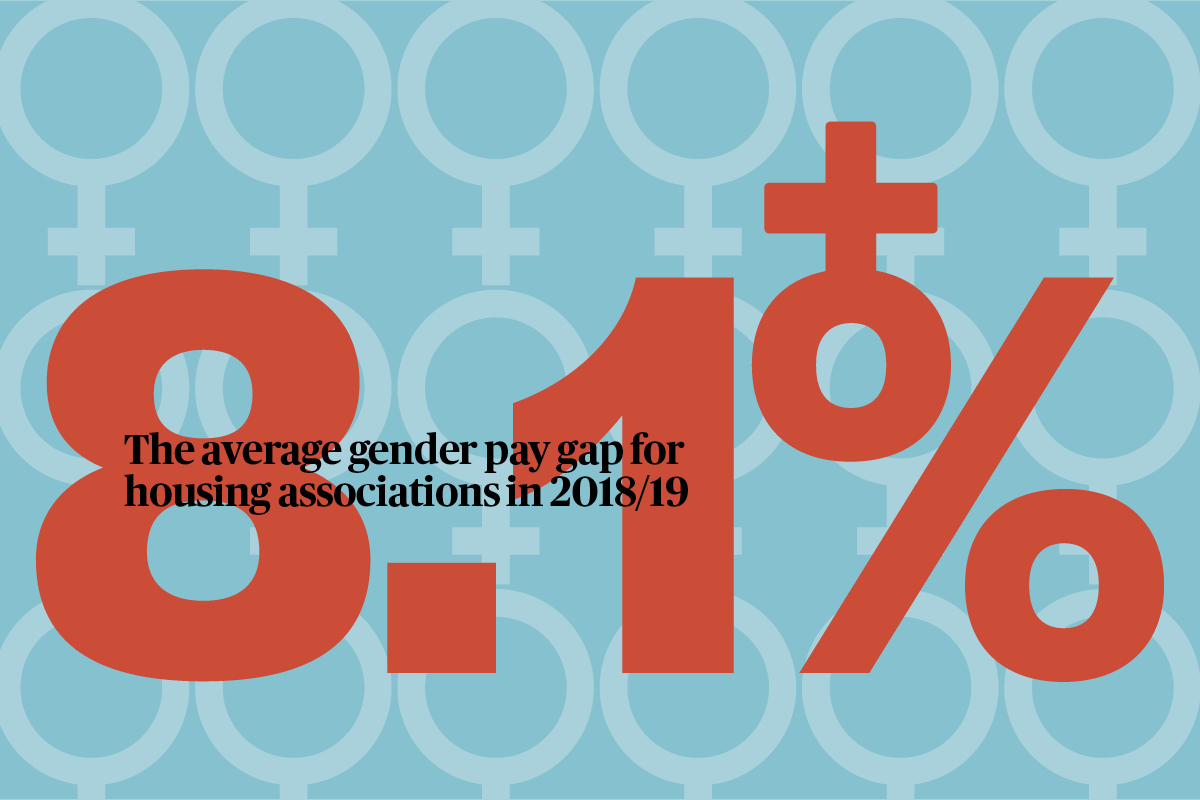
Eight associations’ pay disparity exceeds the national median gender pay gap across all employers, calculated by the Office for National Statistics, of 17.9%. Meanwhile, the average gap across the sample organisations was 8.1%, up from 7.8% last year.
Nicola Dibb, executive director and co-founder of Women in Social Housing (WISH), says it is “really disappointing” that pay gaps have widened in the sector. She is surprised because she thinks “things are getting better, but it’s small steps”.
“I think [attracting women] is a really big issue that people are starting to wake up to in that [organisations] have to have the women coming in at the grassroots level… so that women are coming through the ranks,” she says. “If you have women in senior positions it acts as a culture change.”
“Having women on the board means that wider issues tied with keeping women in organisations are realised and discussed,” she adds.
However, she believes that some organisations struggle to know how to attract more women and promote them to senior positions.
The numbers suggest she is right. The proportion of women in the top pay quartile – the highest-paid employees – fell year-on-year at 23 of 43 associations with comparable figures. Overall, men outnumber women at the top in 34 of 46 landlords analysed.
John Gray, national executive committee member for housing associations at UNISON, questions whether employment practices are the reason some landlords have relatively few higher-paid female managers.
“Some of the organisations are notorious for only paying lip service to part-time work or care arrangements, so this brings into question the governance arrangements for these organisations,” he says. “There are a number of employers which do recognise the value of having managers who work flexible time, or do joint working, and are successful organisations.”
“To put it bluntly, it’s not good enough – we really should be doing better”
Terrie Alafat, chief executive of the Chartered Institute of Housing (CIH), says the latest figures show that the sector has “a long way to go” when it comes to pay equality and the number of women in senior positions.
“To put it bluntly, it’s not good enough – we really should be doing better,” she says. “We know from our own internal research that, as a sector, housing actually employs a higher proportion of women than average. But at the top of our organisations, on our senior teams and boards, it’s a different story.”
The CIH set up a Presidential Commission on leadership and diversity in 2015 to make sure decision-makers are representative of their workforces and the communities they support. Fifty landlords have signed up to deliver against 10 challenges by 2020. Ms Alafat encourages more to get involved.
The Equality and Human Rights Commission (EHRC), which is responsible for ensuring that employers publish their pay gap data, reported in December that 77% of all organisations subject to the regulations last year had a median gender pay gap in favour of men and 14% in favour of women. Nine per cent had no gap.
Housing associations’ gender pay gap data 2018/19
| Housing association | Median gender pay gap 2018 (%) | Median gender pay gap 2017 (%) | Mean gender pay gap 2018 (%) | Mean gender pay gap 2017 (%) | Proportion of women in top pay quartile ie highest-paid 2018 (%) | Proportion of women in top pay quartile ie highest-paid 2017 (%) | Proportion of women in upper middle pay quartile 2018 (%) | Proportion of women in upper middle pay quartile 2017 (%) | Proportion of women in lower middle pay quartile 2018 (%) | Proportion of women in lower middle pay quartile 2017 (%) | Proportion of women in lower quartile ie lowest paid 2018 (%) | Proportion of women in lower quartile ie lowest paid 2017 (%) | Median gender bonus gap 2018 (%) | Median gender bonus gap 2017 (%) | Mean gender bonus gap 2018 (%) | Mean gender bonus gap 2017 (%) | Proportion of women receiving a bonus 2018 (%) | Proportion of women receiving a bonus 2017 (%) | Proportion of men receiving a bonus 2018 (%) | Proportion of men receiving a bonus (2017) |
|---|---|---|---|---|---|---|---|---|---|---|---|---|---|---|---|---|---|---|---|---|
| Halton Housing Trust | Late filing | -4.4 | Late filing | -3 | Late filing | 44.6 | Late filing | 46.7 | Late filing | 27 | Late filing | 53.3 | Late filing | 0 | Late filing | 0.9 | Late filing | 79.7 | Late filing | 78.8 |
| Notting Hill Genesis *1 | 28.6 | N/A | 21.7 | N/A | 48.4 | N/A | 61.7 | N/A | 76.8 | N/A | 76.5 | N/A | 4 | N/A | 11.2 | N/A | 48 | N/A | 41 | N/A |
| Housing & Care 21 | 26.1 | 28 | 35.8 | 36 | 76 | 77 | 91 | 92 | 94 | 93 | 94 | 95 | 0 | 0 | -4.6 | -1.5 | 1.7 | 40 | 1.4 | 22 |
| Stonewater | 24 | 22 | 20 | 23 | 53.8 | 58.1 | 64.3 | 68.9 | 76.4 | 79.2 | 72.5 | 79 | 30 | 27 | 65 | 56 | 17.9 | 89 | 14 | 72 |
| WM Housing Group*2 | 22 | 5.8 | 21 | 15.9 | 49 | 53.2 | 60 | 57.4 | 64 | 58.1 | 67 | 65.6 | N/A | N/A | N/A | N/A | 0 | 0 | 0 | 0 |
| Orbit Group*3 | 21 | 17.3 | 25.1 | 25.7 | 40.8 | 45 | 65.3 | 60 | 70.9 | 73 | 68.2 | 72 | 20.2 | 24.6 | 1.3 | -10.8 | 76.5 | 71 | 73.6 | 68 |
| A2Dominion | 20.9 | 20 | 24.5 | 26 | 45.5 | 46 | 57.3 | 58 | 72.3 | 67 | 72.3 | 79 | 0 | 0 | 46.8 | 50 | 73.3 | 76 | 72.1 | 74 |
| Sanctuary Housing Association*4 | 20.9 | 11.3 | 20.6 | 17.8 | 49 | 49 | 60 | 62 | 72 | 71 | 70 | 64 | 83.2 | 0 | 19.9 | -4.1 | 1.2 | 1.8 | 1.7 | 2.9 |
| Thames Valley*5 | 19.6 | 13.7 | 29.1 | 19.3 | 35.5 | 39.7 | 60.9 | 57.8 | 67.7 | 71.2 | 74.2 | 67.8 | 4.6 | 5.6 | 27.8 | 23.5 | 90.9 | 89.3 | 90 | 90.7 |
| Midland Heart | 17.9 | 15.5 | 20.7 | 19.2 | 48.7 | 48 | 66.5 | 62 | 71.1 | 58 | 74.2 | 74 | 0 | 9 | 92.8 | 91 | 52.5 | 31.2 | 66.9 | 31.9 |
| Metropolitan Housing Trust*5 | 16.3 | 14.8 | 16.6 | 23.3 | 47.3 | 49.4 | 51.2 | 62.2 | 59 | 68.4 | 75.3 | 74.9 | 38.5 | 57.1 | 49.9 | 53.7 | 3.4 | 5.2 | 2.9 | 8.5 |
| Gentoo | 15.9 | 14.6 | 10 | 11.1 | 30.8 | 28.1 | 28.3 | 24.4 | 53.3 | 55.1 | 53.7 | 52 | -46.3 | 13 | -25.8 | 27.9 | 1.5 | 0.8 | 0.5 | 0.5 |
| Onward Homes*6 | 14 | 6.1 | 13 | 8.9 | 47 | 46.6 | 61.6 | 59.7 | 65.5 | 63.5 | 61 | 60.3 | N/A | N/A | N | N/A | 0 | 0 | 0 | 0 |
| Yorkshire Housing | 13.8 | 16.8 | 6.7 | 7.5 | 35 | 36 | 49 | 54 | 63 | 71 | 47 | 46 | 50 | 0 | 17.9 | -8.4 | 21 | 10.3 | 11 | 3.6 |
| Hanover*7 | 13.6 | 26.2 | 24.5 | 29 | 55.6 | 51.7 | 78.4 | 82.2 | 83.9 | 87.2 | 82.9 | 83.7 | N/A | N/A | N/A | N/A | 0 | 0 | 0 | 0 |
| Bron Afon Community Housing | 13.4 | 16.6 | 7.4 | 8.4 | 32.8 | 28.3 | 27.3 | 30.5 | 55.4 | 49.2 | 47.9 | 48.8 | N/A | N/A | N/A | N/A | 0 | 0 | 0 | 0 |
| Yarlington | 13 | 12.5 | 17.7 | 15.4 | 43.9 | 47.7 | 48.5 | 46.5 | 56.1 | 61.6 | 81.4 | 82.4 | 0 | 0 | 20.8 | 32.2 | 75.4 | 84.3 | 72.3 | 87.1 |
| Aspire | 12.4 | 12.9 | 2.6 | 8.2 | 43 | 38 | 40 | 39 | 66 | 47 | 40 | 47 | N/A | N/A | N/A | N/A | 0 | 0 | 0 | 0 |
| Together | 11.5 | 10.5 | 6.8 | 6.4 | 34 | 36 | 41 | 35 | 58 | 47 | 49 | 65 | N/A | N/A | N/A | N/A | 0 | 0 | 0 | 0 |
| One Housing Group | 11.4 | 6.4 | 23 | 18.8 | 50.7 | 50 | 62.1 | 59.6 | 61.7 | 55.8 | 80.2 | 71.8 | 0 | 0 | 38.3 | 46.9 | 53.1 | 65.2 | 41.6 | 69.2 |
| WDH | 11.1 | 11 | 13.3 | 10.9 | 30.2 | 29.6 | 19.2 | 22.6 | 52.6 | 49 | 62.6 | 60.1 | 0 | 0 | 93.2 | 91.9 | 91.4 | 95.2 | 90.9 | 94 |
| Plus Dane Housing | 9.9 | 3.4 | -0.2 | -0.5 | 54.5 | 62.5 | 34.7 | 52.4 | 42.8 | 41 | 54.1 | 48.6 | N/A | N/A | N/A | N/A | 0 | 0 | 0 | 0 |
| Merlin Housing Society*8 | 9.6 | 8 | 16.9 | 12.9 | 31 | 45 | 48 | 41 | 53 | 51 | 62.4 | 66 | -2.9 | -45 | 23 | -32.5 | 22.1 | 0.5 | 18.8 | 1.5 |
| LiveWest*9 | 8.7 | N/A | 16 | N/A | 41 | N/A | 36 | N/A | 46 | N/A | 61 | N/A | 25 | N/A | 23.7 | N/A | 49 | N/A | 65.7 | N/A |
| Your Housing Group | 8.2 | 15.6 | 16.5 | 17.7 | 46.2 | 47.5 | 58.2 | 62 | 57.7 | 67.3 | 64.9 | 65.5 | -262.7 | N/A | -69.5 | N/A | 0.2 | 0 | 8.5 | 0 |
| Optivo*10 | 7.8 | N/A | 12.6 | N/A | 49 | N/A | 70.7 | N/A | 61.4 | N/A | 71.9 | N/A | 0 | N/A | 5 | N/A | 40.6 | N/A | 33.4 | N/A |
| L&Q*11 | 7.6 | 9.5 | 15.9 | 16.6 | 36.9 | 32.6 | 53.7 | 56.7 | 55 | 56.9 | 51.9 | 51.9 | 7.9 | 12.5 | -2.2 | 25.7 | 84.2 | 87 | 80.5 | 77 |
| Bromford*8 | 7.4 | 11.4 | 4.9 | 7.1 | 46.3 | 44 | 44.9 | 34 | 55.8 | 70 | 56.7 | 63 | 0 | 0 | -1.3 | 0.7 | 75.3 | 93.4 | 71.1 | 90.8 |
| Sovereign | 7.4 | 7.2 | 4.4 | 5.2 | 42 | 43 | 39 | 42 | 38 | 40 | 59 | 61 | 65.4 | 55.2 | -7.1 | 20.8 | 17 | 58 | 27 | 61 |
| Home Group | 7.2 | 5.3 | 13.3 | 11.9 | 54.4 | 54.4 | 69.2 | 69.1 | 66.3 | 66 | 69.5 | 65.1 | 20.9 | -635.2 | 43.5 | 51.4 | 19.9 | 10.5 | 16 | 9.2 |
| Accord | 5.6 | 3.9 | 18.8 | 18.6 | 68 | 73 | 81 | 86 | 88 | 88 | 86 | 84 | N/A | N/A | N/A | N/A | 0 | 0 | 0 | 0 |
| Hyde Housing | 2.6 | 4.1 | 13.9 | 12.9 | 47 | 46 | 60 | 61 | 53 | 53 | 60 | 64 | 0 | 1 | 3.3 | 8.8 | 88.3 | 92.9 | 87.1 | 87.8 |
| Coast and Country Housing*12 | 2.4 | 2.4 | -0.7 | 4.7 | 42.5 | 42.2 | 36.7 | 36.7 | 48.8 | 52.3 | 47.7 | 51.2 | 0 | N/A | 6.3 | N/A | 3.1 | 0.4 | 6.3 | 0 |
| Catalyst | 2 | 0.3 | 4.8 | 0.5 | 42.4 | 45.5 | 54 | 55.9 | 72 | 69.7 | 32.7 | 35.4 | 0 | 0 | 1.2 | -0.9 | 86.1 | 74.6 | 78.6 | 69.7 |
| Paradigm Housing Group | 1.9 | 0 | 12.6 | 9.7 | 40 | 40 | 48 | 51 | 33 | 24 | 69 | 73 | N | N/A | N/A | N/A | 0 | 0 | 0 | 0 |
| The Wrekin Housing Trust | 1.8 | 1.8 | 7.4 | 8.3 | 43.6 | 43.7 | 42.9 | 44.4 | 55.3 | 57.5 | 44.7 | 50 | 46.1 | 29.2 | 39.8 | 11.7 | 2.8 | 3.8 | 2.1 | 2.9 |
| Clarion | 0.7 | -1.8 | 4.4 | 5 | 46.1 | 46.2 | 58.1 | 61.6 | 61.4 | 60.9 | 44.7 | 43.3 | 0.7 | -3.1 | 9.9 | 23 | 83.2 | 75.3 | 81.3 | 72.4 |
| Waterloo Housing Group | 0.1 | 4.9 | 9.4 | 12.1 | 50 | 58 | 64 | 58 | 58 | 61 | 56 | 50 | N/A | N/A | N/A | N/A | 0 | 0 | 0 | 0 |
| Thirteen | 0 | 0.2 | 4.4 | 7 | 41.2 | 44.3 | 50.4 | 53.2 | 23.7 | 26.4 | 69.6 | 71.6 | N/A | N/A | N/A | N/A | 0 | 0 | 0 | 0 |
| Choices Housing Association | 0 | 0 | -1.8 | 0 | 87.7 | 84.4 | 86.2 | 84.4 | 88.4 | 81.2 | 83.3 | 88.2 | 0 | 0 | -17 | 33 | 16.1 | 30.3 | 14.7 | 45.3 |
| Peabody Trust *13 | 0 | -7.1 | 5.5 | -2.4 | 45.2 | 48.9 | 60.4 | 50.2 | 60.2 | 58.3 | 43.4 | 26.5 | 0 | 0 | 14 | 14.2 | 58.5 | 79.8 | 68.4 | 75.6 |
| Origin Housing | -0.2 | -1.6 | 4.5 | 4.1 | 44.4 | 42.6 | 62 | 63.2 | 56.3 | 49.2 | 52.1 | 53.7 | 11.3 | 0 | 21.6 | -2.9 | 13.8 | 53.9 | 8.6 | 54.3 |
| The Guinness Partnership | -0.2 | -4.8 | 8.8 | 6.4 | 44 | 48.3 | 63 | 59.4 | 56 | 53.7 | 49 | 51.3 | -3.8 | 0 | 2.5 | 4.3 | 76 | 58.3 | 75 | 50 |
| Places for People*14 | -0.3 | 6.3 | 3.2 | 5 | 42.3 | 40.3 | 31.6 | 31.9 | 19.7 | 29.2 | 52.6 | 58.6 | 47.1 | 91 | 8.5 | 80 | 2.2 | 2.1 | 2.5 | 1.9 |
| Riverside | -0.3 | 6 | 7.1 | 8.1 | 53 | 55.3 | 75.8 | 70 | 67.2 | 70.6 | 59.3 | 61.4 | 0 | 0 | 9.7 | 10 | 77.5 | 74.8 | 75.6 | 76 |
| Great Places | -16.4 | 0.4 | -3.2 | 8.4 | 72 | 72 | 77 | 74 | 66 | 75 | 54 | 67 | N/A | N/A | N/A | N/A | 0 | 0 | 0 | 0 |
| Glasgow Housing Association | -48.4 | -45.9 | -27.4 | -25 | 58.4 | 57.5 | 66.7 | 66.2 | 18.1 | 21.7 | 16.4 | 16.5 | N/A | N/A | N/A | N/A | 0 | 0 | 0 | 0 |
Notes
The data above was originally published as part of our investigation 'Housing's gender pay gap problem' and was correct as of 12 April 2019
*1 Genesis and Notting Hill Housing merged in April 2018. Genesis had a median pay gap of 28.6% in April 2017; Notting Hill Housing Trust of 19.8%.*2 These are figures for West Mercia Homes. WM Housing Group has an overall median gender pay gap of 12.07%.*3 The 2017 data is different to that originally reported by Inside Housing because Orbit restated their figures to the government after the gender pay gap deadline.*4 These figures are for Sanctuary Housing Association, one of eight entities that make up the Sanctuary group.*5 These figures pre-date Metropolitan’s merger with Thames Valley in October 2018.*6 Due to transformational change, Onward Homes is now Onward Group.
*7 These figures pre-date Hanover’s merger with Anchor in November 2018.*8 These figures pre-date Merlin’s merger with Bromford in July 2018.*9 LiveWest was created by the merger in March 2018 of DCH and Knightstone. DCH had a median gender pay gap of 12.7% for April 2017; Knightstone of 11.6%*10 Viridian and AmicusHorizon amalgamated in May 2017 to form Optivo. Viridian had a median gender pay gap of 27.4% in April 2017; AmicusHorizon of 7.5%.*11 The median gender pay gap at L&Q Living is 1.7%.*12 These figures pre-date the association’s merger with Yorkshire Coast Homes in October 2018 to form Beyond Housing.*13 Family Mosaic is part of Peabody following a merger in July 2017. Family Mosaic’s median gender pay gap in April 2017 was 19.4%.*14 These are figures submitted for Places for People’s regulated housing activities.
A minus gender pay gap means women are paid more than men.
By comparison, last year Inside Housing found that 84% of housing associations had a median gender pay gap in favour of men and 12% had one in favour of women. Four per cent had no gap.
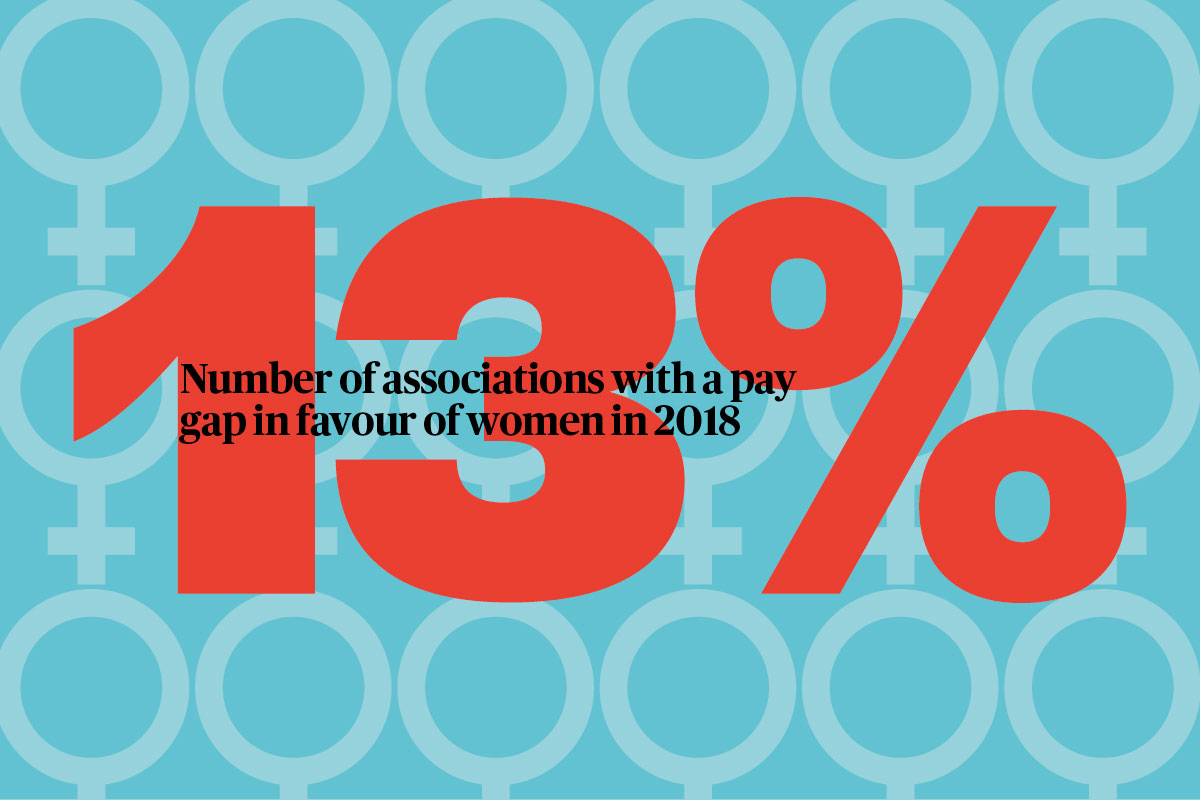
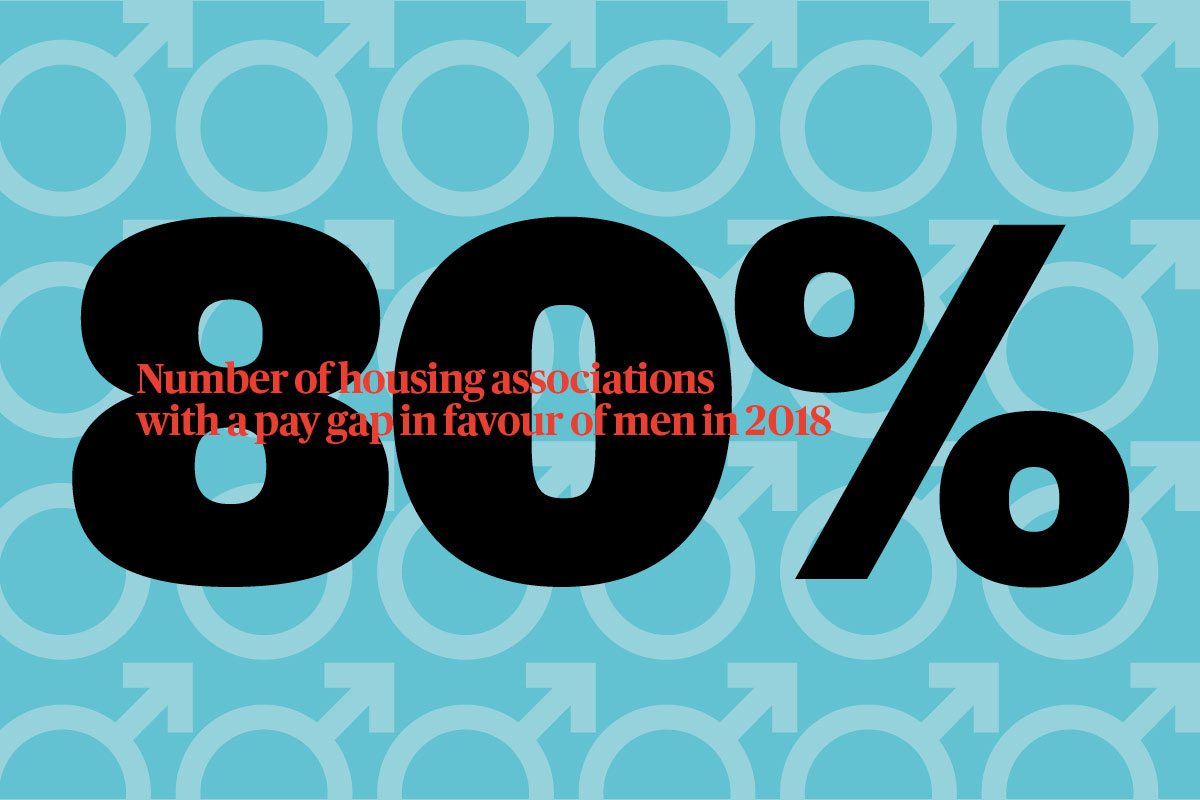
This year, the proportion of associations with a gap in favour of men has fallen to just over 80%, while 13% have a gap in favour of women and just under 7% have no gap.
But how can associations eliminate a gap? Heather Ashton, executive director of resources at 34,000-home Thirteen, which cut its median gender pay gap from 0.2% to zero, says there is “no magic formula”. However she says it helps that Thirteen attracts “a good mix of males and females”: men account for 50.1% and women 49.9% of its 1,500 employees, and staff within the top two pay quartiles are “pretty balanced”.
That said, the proportion of women fell within every quartile in a year. This could be a result of women taking time out to have children or progress their careers at other organisations, says Ms Ashton.
The EHRC’s report highlights areas that employers could focus on to reduce their gender pay gap: recruitment, development and promotion; flexible working; caring and shared parental leave; apprenticeships; positive action; bonuses and performance-related pay; and monitoring data. Suggested actions include anonymising CVs and application forms, trialling new ways of working, enhancing the statutory minimum paternity leave and using positive action in apprenticeships.
Ms Ashton says that factors contributing to Thirteen’s pay parity include family-friendly policies, flexible working arrangements such as part-time and home working, and the use of “spot salaries” – as opposed to graded pay bands – for individual job roles across the organisation. This means that an administrator earns the same whether they work in HR, finance or property services.
“The other thing we have done is to recognise [that] for some people, working flexibly means having the right kit as well,” says Ms Ashton. “We have made a conscious effort to push out more laptops and tablets so they can do the first couple of hours from home around taking the kids to school.”
Back at Your Housing Group, Mr Joyce says agile working has had “a massive impact”. “It’s not just working from home, because I think that is old hat,” he says of the association’s approach. It is about working “wherever you want, however you want, whenever you want”.
The landlord is being “more creative” about how it fills senior roles, says Mr Joyce, recognising that its gender pay gap is due to not having enough women in top jobs. It offers flexibility including part-time work and condensed hours. “There is no rule,” he says. “We are open to anything.”
The organisation, which has a target of having 50% of roles in its four highest pay bands filled by women by 2025, is attracting talent from inside and outside the sector as a result. Mr Joyce highlights the appointment of Dawn Williams, who joined last year as director of business planning and who works a four-day week.
Your Housing Group launched a Women’s Working Group – since renamed Balance for Better by its 20 (female) members – last year to inform the (male) executive team of perceived barriers to career progression for female staff. One result is a new leadership scheme, expected to launch later this year, which will pair female employees with a mentor from the executive team.
Mr Joyce says that the group is also “self-reflecting”, considering whether women need to challenge and improve some of their own behaviour in the workplace. He points to negotiating skills; in his HR role, he has a much tougher time discussing pay with men than women.
Ms Dibb says that sometimes women “don’t put themselves forward” and WISH supports women to be more confident.
However, progress also lies in making men aware of the challenges women face. “There’s no point just preaching to the converted and talking to a room full of women,” says Ms Dibb. “We need to be talking to the men as well and opening their eyes to the issues.”
For now, women continue to be short-changed.
Inclusive Futures
Inside Housing’s Inclusive Futures campaign aims to promote and celebrate diversity and inclusion.
We are pledging to publish diversity audits of our own coverage.
We are also committed to proactively promoting positive role models.
We will do this through the pages of Inside Housing. But we will also seek to support other publications and events organisations to be more inclusive.
Our Inclusive Futures Bureau will provide a database of speakers and commentators from all backgrounds, for use by all media organisations.
We are also challenging readers to take five clear steps to promote diversity, informed by the Chartered Institute of Housing’s diversity commission and the Leadership 2025 project.
INSIDE HOUSING’S PLEDGES
We will take proactive steps to promote positive role models from under-represented groups and provide information to support change.
We pledge to:
Publish diversity audits: We will audit the diversity of the commentators we feature. We will formalise this process and publish the results for future audits twice a year.
Promote role models: We will work to highlight leading lights from specific under-represented groups, starting in early 2018 with our new BME Leaders List.
Launch Inclusive Futures Bureau: We will work with the sector to compile a database of speakers, commentators and experts from under-represented groups. The bureau will be available to events organisers, media outlets and publications to support them to better represent the talent in the sector.
Take forward the Women in Housing Awards: Inside Housing has taken on these successful awards and will work to grow and develop them.
Convene Inclusive Futures Summit: Our new high-level event will support organisations to develop and implement strategies to become more diverse and inclusive.
THE CASE FOR CHANGE
34%
of housing association chief executives are female
1%
of housing association executives have a disability
1.6%
of housing association board members are LGBT
Women make up 46% of the UK workforce, but Inside Housing research found that they are under-represented on housing association boards (36%), executive teams (39%) and among chief executives (34%).
Almost a fifth of working-age adults have a disability (18%), yet associations reported only 1% of executives and 4.5% of board members with a disability. Many were unable to provide details.
Nationwide, 14% of the working-age population come from a BME background, climbing to 40% in London and Birmingham. Yet our research found that 6.8% of board members identified as BME, compared with 4.5% of executives.
Statistics on representation of LGBT people in the workforce are in short supply, but official statistics suggest that 2% of the total UK population identify as lesbian, gay or bisexual, rising to 4.1% for 16 to 24-year-olds. Our survey found that 1.6% of board members and 10 executives were LGBT – but most organisations were unable to provide figures.
THE INCLUSIVE FUTURES CHALLENGE
Inside Housing calls on organisations to sign up to an inclusive future by taking five steps:
Prioritise diversity and inclusion at the top: commitment and persistence from chief executives, directors and chairs in setting goals and monitoring progress.
Collect data on the diversity of your board, leadership and total workforce and publish annually with your annual report. Consider gender, ethnicity, disability, sexuality, age, and representation of tenants on the board.
Set aspirational targets for recruitment to the executive team, board and committees from under-represented groups.
Challenge recruiting staff and agencies to ensure that all shortlists include candidates from under-represented groups.
Make diversity and inclusion a core theme in your talent management strategy to ensure you support people from under-represented groups to progress their careers.
