Less than half of shared owners satisfied with overall service, first-year TSM results show
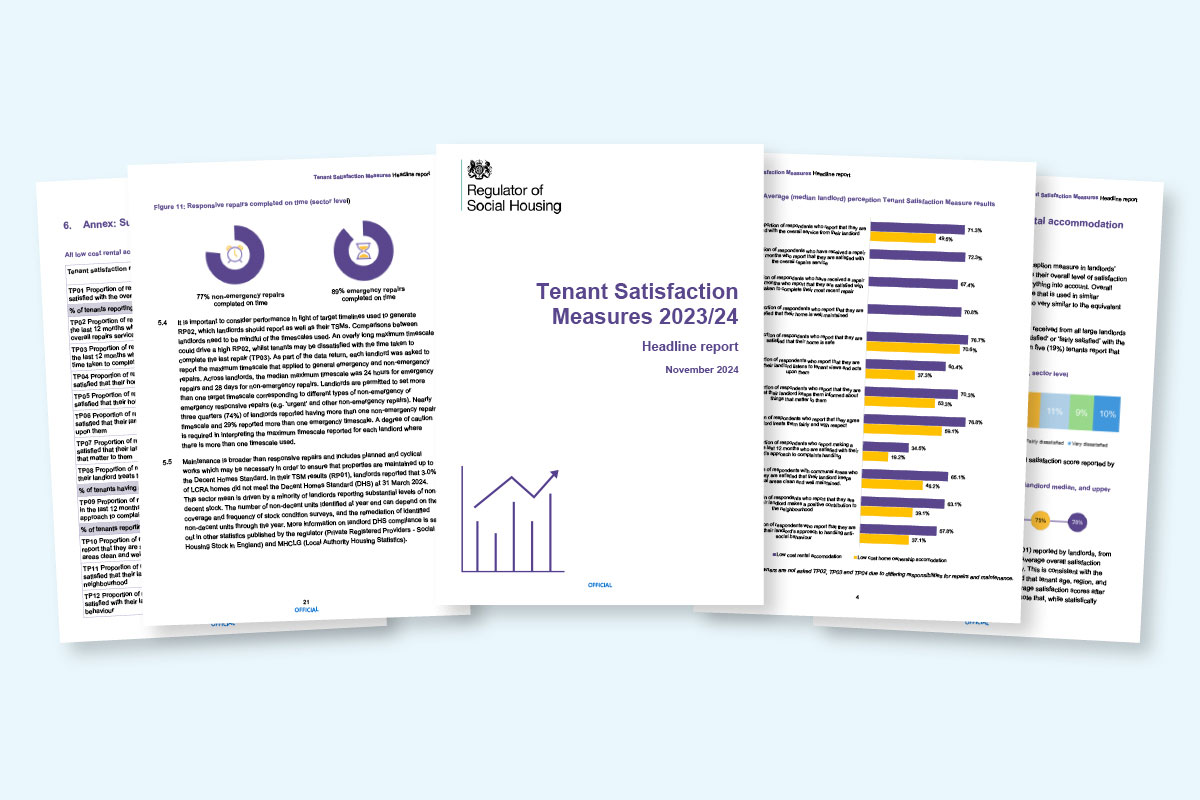
Less than half of shared owners are satisfied with the overall service from their social landlord, compared with seven in 10 tenants, the English regulator’s data from the first year of the tenant satisfaction measures (TSMs) has shown.
A major analysis by the Regulator of Social Housing (RSH) of the TSMs for 2023-24 found that 49.5% of shared owners and 70% of social tenants are either very satisfied or fairly satisfied with the overall service from their landlord.
Where shared owners are dissatisfied, their reasons included rent or service charges (38%), repair issues (33%), and general customer service (26%).
The regulator also found that the biggest driver of overall satisfaction with a social landlord is tenants’ view of the repairs service they received – 64% of tenants that are dissatisfied with the overall service cited repair issues as the reason why.
The RSH’s analysis is based on 360 submissions from large landlords that have 1,000 or more homes, and covers the period between April 2023 to March 2024.
The TSMs, which come under the Transparency, Influence, and Accountability Standard, are a set of 22 measures and are the primary way to understand how residents feel about their social landlord.
Nearly half a million tenants took part in the TSMs.
Of the measures, 12 are collected through tenant perception surveys and cover topics such as repairs service and anti-social behaviour. The rest are based on landlord management information and cover health and safety checks.
Landlords completed over 480,000 surveys in total. Almost 455,000 of these were completed with tenants of low-cost rental accommodation and just under 28,000 with shared owners.
On average, tenants reported the highest levels of satisfaction with overall repairs service (72%), that their home is safe (77%), and their landlord treats them with fairness and respect (77%).
However, the regulator said there is “still room for improvement” as around one in five tenants are not satisfied with their landlord’s service, and only one third of social housing tenants are satisfied with the way landlords handle complaints.
Complaint-handling has the lowest level of satisfaction among all the TSM perception questions – 35% for social tenants.
In terms of how landlords approach anti-social behaviour, on average 58% of tenants are satisfied, compared with 37.1% of shared owners. Of the tenants who reported anti-social behaviour to their landlord in the past 12 months, around half (48%) stated they would like to see improvements in the approach.
The regulator also published the findings of its National Tenant Survey, which involved 3,500 social housing tenants and shared owners, and included some interviews.
The survey aims to provide an independent benchmark for the TSMs and help the RSH scrutinise the data submitted by landlords. It included all perception TSM questions, as well as additional questions to explore tenants’ responses in greater depth.
The regulator’s analysis found that landlords with the majority of their homes located in London reported significantly lower median overall satisfaction (59.7%). Landlords operating predominantly in the Midlands (74.6%) and the North (74.3%) reported higher median levels of satisfaction.
Smaller landlords reported higher average overall satisfaction than larger landlords. Landlords that own fewer than 5,000 homes reported median satisfaction (73.6%), compared with those with 40,000 or more homes (65.9%).
Landlords with a high proportion of supported housing homes typically reported higher overall satisfaction – a median score of 77.5%.
Average (median landlord) management information tenant satisfaction measure results
| Tenant satisfaction measure | Median landlord score |
| BS01: Proportion of homes for which all required gas safety checks have been carried out | 99.9 |
| BS02: Proportion of homes for which all required fire risk assessments have been carried out | 100.0 |
| BS03: Proportion of homes for which all required asbestos management surveys or re-inspections have been carried out | 100.0 |
| BS04: Proportion of homes for which all required legionella risk assessments have been carried out | 100.0 |
| BS05: Proportion of homes for which all required communal passenger lift safety checks have been carried out | 100.0 |
| RP01: Proportion of homes that do not meet the Decent Homes Standard (LCRA only) | 0.5 |
| RP02: Proportion of non-emergency responsive repairs completed within the landlord’s target timescale (LCRA only) | 81.3 |
| RP02: Proportion of emergency responsive repairs completed within the landlord’s target timescale (LCRA only) | 95.3 |
| NM01: Number of anti-social behaviour cases opened (per 1,000 homes) | 35.5 |
| NM01: Number of anti-social behaviour cases that involve hate incidents opened (per 1,000 homes) | 0.6 |
| LCRA | LCHO | |
| CH01: Number of stage one complaints received (per 1,000 homes) | 42.5 | 35.2 |
| CH01: Number of stage two complaints received (per 1,000 homes) | 5.7 | 9.0 |
| CH02: Proportion of stage one complaints responded to within the Housing Ombudsman’s Complaint Handling Code timescales | 82.3 | 73.2 |
| CH02: Proportion of stage two complaints responded to within the Housing Ombudsman’s Complaint Handling Code timescales | 83.6 | 78.6 |
The national tenant survey findings suggested that a tenant’s age, their landlord size, their sex, whether they live inside or outside of London, or whether they have a disability, all have an independent influence on average overall satisfaction.
Of these characteristics, tenant age is the most influential – people over 65 have significantly higher overall satisfaction (82%) compared with other age groups.
This may be impacted by the higher number of older tenants in supported accommodation, the RSH said, and higher average satisfaction may also reflect additional services typically provided by specialist landlords.
The regulator found that average overall satisfaction varies across several factors, including region, landlord size and amount of supported housing. However, evidence from its survey suggested that the quality of landlord services is likely to be the primary factor in explaining variation in tenant satisfaction and other factors are generally a secondary influence.
In terms of landlords’ management data, most reported that they completed the required health and safety checks and have also reported that the majority of tenants live in homes meeting the Decent Homes Standard.
Most landlords report full compliance on each building safety measure, putting the landlord median for each at or near 100%.
As of 31 March 2024, the vast majority of homes owned by large landlords required gas (99.3%), fire (97.9%), asbestos (94.4%), water (92.2%) and lift safety checks (93.8%) completed.
More than three-quarters (77%) of the 10.6 million non-emergency responsive repairs completed during 2023-24 were completed within target timescales. While 73% of more than 250,000 stage-one complaints made during 2023-24 were responded to within the timescales in the Housing Ombudsman’s complaint-handling code.
Survey methods
The regulator found “substantial” consistency in the survey collection methods used by landlords.
While landlords typically use more than one collection method in order to reach a range of tenants, the majority (65%) used telephone surveys as their predominant collection method. Predominate means that more than 50% of surveys were collected using that method.
For the TSMs, landlords have flexibility with the collection methods they use for surveying, such as phone, in person and online. They are required to use methods that address barriers to participation and consider other factors such as response rate, the profile of their tenants and the representativeness of responses.
Certain collection methods are known to achieve better results.
According to the regulator, the “evidence suggests a significant impact of survey collection method on the satisfaction score”, including in collection methods where staff and contractors ask tenants the questions and report their response.
The RSH explained: “For example, while telephone surveys had an average satisfaction of 70%, average scores for internet surveys (58%) were significantly lower, and for face-to-face surveys significantly higher (75%).
“The regulator considers that the predominant survey collection method is fundamental context to assessing each landlord’s satisfaction scores – this is especially the case for landlords using a predominant survey collection method that diverges from that commonly used by other landlords.”
One of the issues the regulator encountered when reviewing TSM data returns was a “lack of transparency over the survey collection method in the summary of approaches published by some landlords”.
“While the landlord-level data published by the regulator sets out survey collection method, it is important that landlords also set this out clearly alongside their own published results,” the report said.
The regulator added that all landlords are required to set out their survey collection method along with a rationale for the method(s) chosen, “particularly” where landlords have used a predominant survey collection method that “diverges from that commonly used” by others.
Fiona MacGregor, chief executive of the RSH, said landlords should “already be reflecting” on their results and “using them to improve their services”.
She added: “The TSMs are one piece of intelligence that we use to build an overall picture of a landlord’s performance, as part of our new proactive regulation of the consumer standards.
“We are rolling out our new approach through planned inspections, investigations and scrutinising a range of information from landlords. Through our work, we are continuing to drive landlords to improve tenants’ homes and services.”
The regulator said it is following up with landlords whose results indicate they are outliers, including on health and safety indicators.
It is also engaging with landlords whose TSMs are inaccurate and have not been collected in the right way.
Sign up for our daily newsletter
Already have an account? Click here to manage your newsletters


