Fact check: did Boris Johnson ‘massively outbuild Labour’ as London mayor?
At the BBC Question Time leader’s special on Friday, Boris Johnson repeatedly claimed to have “massively outbuilt Labour” as London mayor. But did he? Peter Apps checks the numbers
Short answer: No. Overall housebuilding was lower in London during Boris Johnson’s regime (average 26,144 homes per year, according to the Ministry for Housing, Community and Local Government’s net additional dwellings data) than either Ken Livingstone (26,474) or Sadiq Khan (35,747) – although this is mostly to do with macroeconomic factors.
In terms of homes delivered through government-funded programmes Mr Johnson can only claim to be ahead by counting homes delivered under programmes designed and administered by the central Labour government before devolution of housing budgets in 2012. On a like-for-like comparison of his programmes, he is well behind Mr Khan.
Long answer: Comparing mayoral housebuilding records in London is so difficult as to be almost impossible – but it is also a task regularly undertaken by those on both sides of the political divide.
The difficulty comes first from deciding which housebuilding figures exactly are to be compared. Are we talking about overall housebuilding? Affordable housing? Or just those built as a result of the decisions taken in City Hall?
The next question is what is the right period for comparison. Unhelpfully, grant programmes in London do not track mayoral terms, meaning the incumbent will always be taking the credit (or the blame) for their predecessor’s work to a certain extent.
So how can Mr Johnson’s claim be analysed?
Let’s start with the easiest question: how many homes were built, overall, in London during each mayor’s tenure? For this, I have used the net additions figures, which are generally preferred as the most authoritative set of figures on housebuilding.
These figures provide a breakdown for London starting from 2001/02, which means we skip the first year of Mr Livingstone’s two terms in office.
The figures show 185,321 new homes over the next seven years, rising steadily every year to a peak of 31,557 in 2007/08. This gives Mr Livingstone an average of 26,474 for the seven years for which we have data.
Mr Johnson’s eight years in office then saw a dip to coincide with the general economic downturn between 2009 and 2013. Figures rose again after that to a peak of 30,390 in his last year in office. His average is 26,144 a year.
Mr Khan then somewhat blows the other two away with record building across the three years for which we have data, delivering an average of 35,747 – higher than the peak figures of either Mr Johnson or Mr Livingstone.
What can we take from this about who was the better mayor? Probably very little. The 2000s were a period of steady economic growth, while Mr Johnson oversaw London through a global economic downturn and Mr Khan took over post-recovery in a climate of political emphasis on housebuilding. The rise when he took office was too soon to be meaningfully credited to any of his policies. It certainly does not, however, show Mr Johnson “massively outbuilding Labour”.
Things get more complex when we consider affordable, or state-funded, housing. This is where the mayor of London actually has some influence, which makes it much more relevant to this debate.
For this we have primarily used the Greater London Authority’s own dataset. That starts from 2008, so can only really be used to compare Mr Johnson and Mr Khan.
The most surface-level reading of it would appear to support Mr Johnson’s claim: across his eight years in office, 94,001 homes were built through mayoral programmes at an average of 11,750 a year. This beats Mr Khan (21,139 at an average of 6,039) considerably and Mr Livingstone as well (overall data on affordable housing shows 85,796 affordable homes delivered between 2000 and 2008 – an average of 10,725).
But this does not tell the full story.
Homes completed during Mr Johnson’s time in office came, in the early years, from the National Affordable Homes Programme set up by the Labour government, over which he had no influence.
This accounts for 63,222 of the completions during his years in office – around two-thirds of the total.
This programme was then followed by the Affordable Homes Programme 2011/15 – which was set up nationally but devolved to City Hall to administer from 2012. This programme delivered 17,845 completions.
While Mr Johnson did not design this programme, his officials had a big impact on it – especially in closing out the completions. So it may be reasonable for him to claim some credit.
But during his time in office, programmes he designed and managed delivered just 6,694 of the completions and 16,118 starts.
How to compare this with Labour? With mayoral terms not matching programmes, you need to look beyond the time in office. In total, Mr Johnson’s programmes have delivered 21,722 new homes in the capital so far (many of the completions falling under Mr Khan’s watch).
But comparing this number with Mr Khan would be unfair, as he too needs some time for his programmes to turn into completed homes. Perhaps the only way fair way of measuring them against each other is starts. And in this regard Mr Khan is flying in front of Mr Johnson.
In their first two full years, Mr Khan’s programmes have produced 23,511 starts. In the equivalent period, Mr Johnson’s produced 14,031.
This is pretty clear evidence that once both programmes have run a full cycle, Mr Khan’s (which complete in 2020/21) will have proved more fruitful.
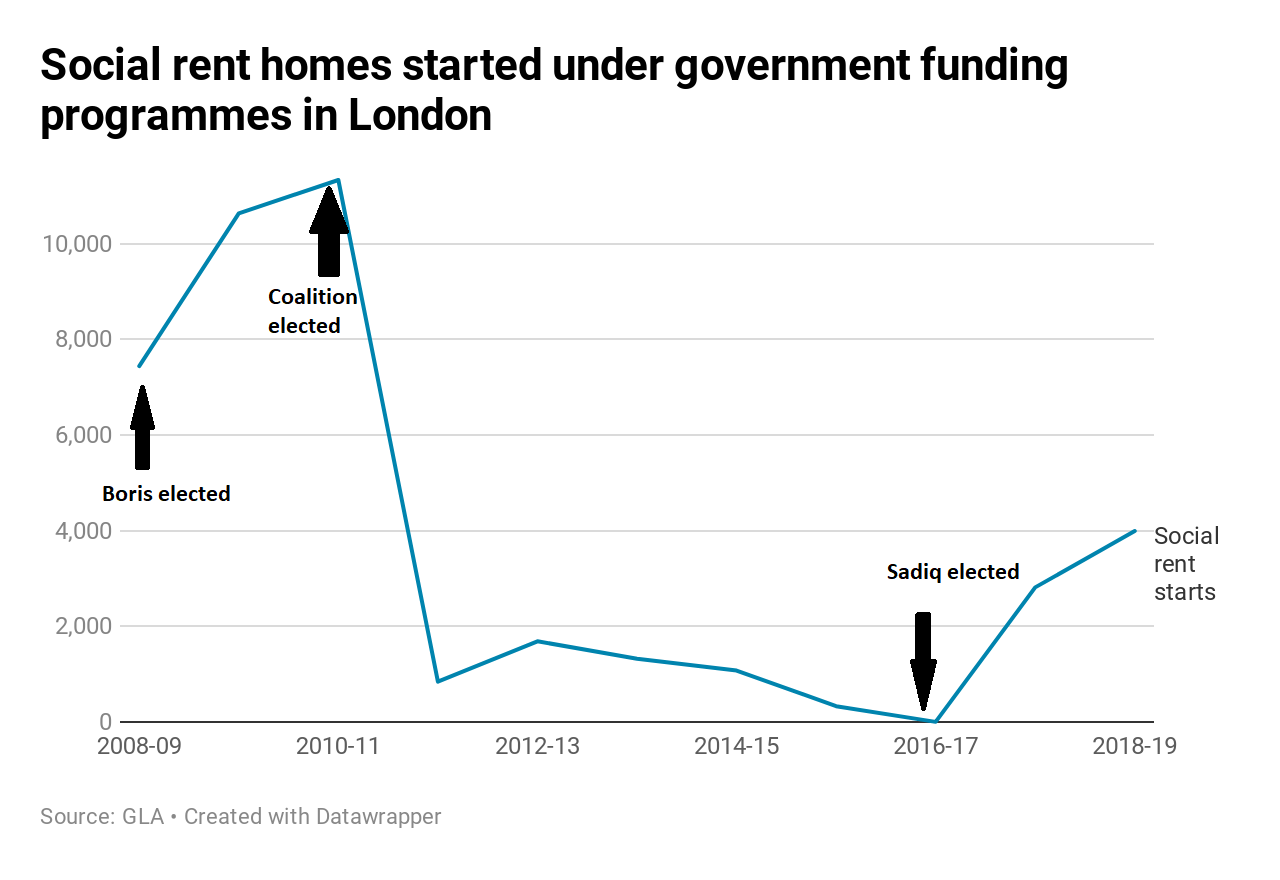
A final note on Mr Johnson’s influence on housing delivery at City Hall is that his programmes directed funding away from social rent in favour of ‘affordable’ rent or shared ownership.
This means a lower cost per property and should increase the overall volume, but it did not.
It also meant that in 2016/17 – the only year when almost all housing delivery came through Mr Johnson’s programmes – the number of social rent homes started in the whole of London through government programmes was three.
