You are viewing 1 of your 1 free articles
How English housing has changed over the past 50 years
The government’s English Housing Survey is now 50 years old, and much has changed since the first publication, as Carl Brown discovers.


 The Department for Communities and Local Government last week published a comparison of the English Housing Survey (EHS) findings in 1967, to the most recent one published earlier this year.
We pick out the key changes in tenure patterns, build rates, stock condition and demographics during the past 50 years.
Tenure
It won’t surprise you to learn that there has been a 40% decrease in the proportion of the population living in social housing since 1967, according to EHS data.
Fifty years ago nearly a third of the English population, 29%, lived in social housing. This has dropped to 17%.
Correspondingly the percentage of the population in owner-occupation has leapt 22% over the same period.
A fifth of the population (20.1%) is in the private rented sector, a figure almost the same 50 years ago.
But don’t be fooled into thinking that the private rented sector figures haven’t shifted in the past 50 years, or that owner-occupation has been rising constantly.
The graph below shows what actually happened since 1967.
You can see the proportion in private renting dropped throughout the 1960s and 1970s, hitting a low point of 9.4% in 1991.
Social renting, on the other hand, accounted for more and more of the population, hitting a high point in 1981 of 31.7% of the population in the tenure.
We all know what has happened since.
Cuts to grant funding for social homes, restrictions on councils developing social housing and the Right to Buy have led to the private rented sector overtaking the social sector back to the 20% mark it was hitting in the late-1960s/early-1970s.
Owner-occupation has had a much publicised dip in recent years, but at 62.9% of the population is still a lot higher than it was in the 1960s, 70s and 80s.
Housebuilding
The 50 Years of the English Housing Survey document also uses other Department for Communities and Local Government datasets to chart housebuilding since the end of World War II.
Overall development, as is much publicised, has plummeted over the past few decades.
There were 352,540 homes completed overall in England in 1968.
Completions have dropped significantly since then, hitting a low of 106,720 in 2010 before increasingly to 140,850 in 2016.
The fall has been fairly constant, although there were increases in completions for a number of years in the late-1980s and mid-2000s at the time of economic booms.
Council housing completions were at their highest in 1953, overseen by the Conservative housing minister Harold Macmillan.
A total of 198,210 homes were completed in England by local authorities during that year - more than the entire number of housing completions overall in recent years.
Council housing completions dropped to a pitiful low of 360 in 2009.
Many councils are now looking to re-enter development, but their activity has yet to feed through into significant numbers of completions, with slightly more than 2,000 completed in 2016.
Housing associations have been steadily upping their numbers, completing 23,990 homes in 2016, although it should be pointed out that these figures do not include new homes delivered by housing associations through Section 106 planning agreements.
In recent years, a measure of poor housing has been whether a home has one of 29 potential housing health and safety rating system (HHSRS) hazards at ’category one’, including “falls on stairs” and “excess cold”.
The proportion of homes with these hazards has dropped from 21.6% in 2006 to 12.4% in 2015.
A more familiar measure to modern readers is the New Labour government’s Decent Homes Standard.
According to the National Housing Survey, 19.4% of English homes were failing to meet the updated 2006 Decent Homes Standard in 2015, down from 35% in 2006
Household size
Households have got significantly smaller since the 1960s. The 50 Years of the English Housing Survey document uses census figures to show the average household size was three people in 1961, but dropped to 2.4 people in 2015/16.
This was due in part to a large increase in the number of households with just one or two people, which made up 64% of households in 2015/16, compared to 43% in 1961.
How has the survey itself changed?
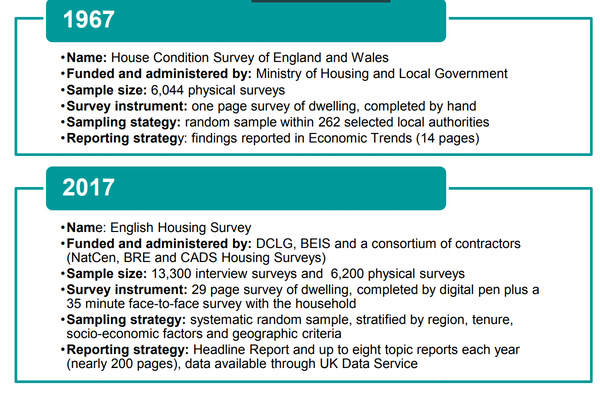
The survey has massively expanded in scope since 1967.
In 1967, The English House Condition Survey (EHCS), as it was then called, focused primarily on stock rather than households.
It consisted of 6,044 physical examinations of buildings, selected randomly within 262 selected council areas. The survey form was just one page long.
In 2008 the EHCS combined with another survey called the Survey of English Housing to become the English Housing Survey.
Last year’s survey consisted of 13,300 interviews and 6,200 physical surveys with a much more sophisticated sampling technique.
Below, is a summary from the Department for Communities and Local Government showing the main differences.
