You are viewing 1 of your 1 free articles
Experiences of homelessness: an interview with Lewisham Mayor Damien Egan
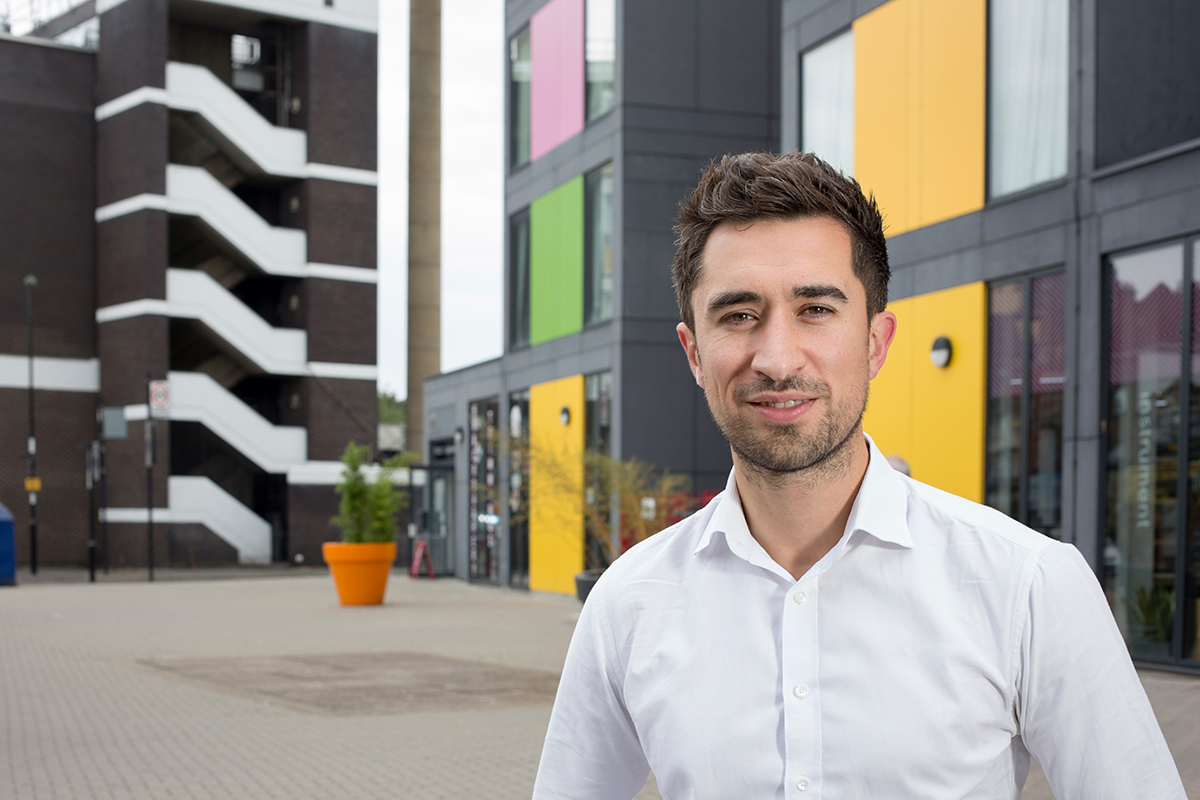
Damien Egan’s family went through homelessness twice when he was growing up. Today, the Lewisham mayor needs to find a solution for hundreds of families in a similar position. Jess McCabe asks him about his plan. Photography by Jonathan Goldberg
Halfway down Lewisham High Street is a surprising modern building. This is Place/Ladywell, a modern shock of colourful blocks on the slightly ramshackle south London high street.
On top are 24 flats – temporary accommodation for homeless families. Underneath is a coworking space and units for little independent businesses.
“We had some graffiti on this when it was getting built which said ‘no more homes for yuppies’, and I thought that was actually such a good thing because it shows that it’s such good quality,” says Damien Egan, the new mayor of Lewisham, who was cabinet member for housing when this scheme was conceived.
“I remember being in a council flat at one stage and being so embarrassed. I wouldn’t have friends home from school because I was just so embarrassed at how grim the building was. This is completely different. That’s what I want for residents – why can’t they have nice housing?”
READ MORE


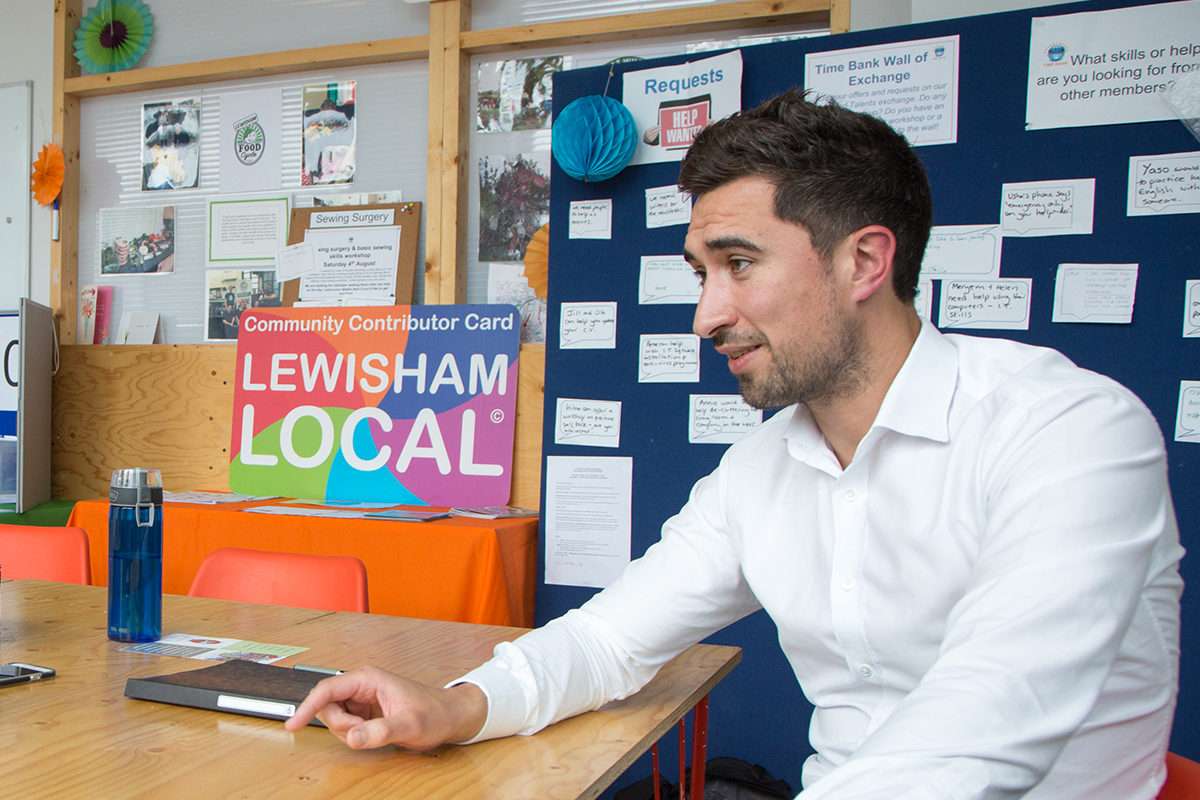
Inside Housing has come here to meet Lewisham’s new mayor a few months into the job, and we assemble for the interview in one of the downstairs units, being used to run a timebank.
It’s a useful interview location: here is a project that sums up the impression Mr Egan is seeking to make of bringing a radical, yet modern, approach to the housing crisis and stimulating local independent businesses. Built in a factory, and opened in 2016, in a few years this building will be disassembled and moved to another bit of empty land when Lewisham Council gets on with developing the site. (The families in temporary accommodation have been promised permanent housing when that happens.)
“I remember being in a council flat and being so embarrassed.”
Mr Egan swept the board at the mayoral election in May, gaining 54% of the vote – with the Conservative runner-up only managing to draw 13%. A Labour manifesto full of big pledges on housing was part of the reason why.
For Mr Egan, this is personal. The 36-year-old, who grew up in Bristol before moving to London to go to St Mary’s University in Twickenham, explains: “When I was growing up with my mum and my sister we had two instances where we went through homelessness. It really sticks with you, that insecurity.”
In his campaign, Mr Egan promised to add 1,000 social homes, as well as a new generation of council-owned private rented homes.
He also promised to build four more developments just like Place/Ladywell, to bring some of the council’s homeless families out of B&Bs and hostels (Lewisham has about 500-600 families in temporary accommodation).
There was a promise not to sell ‘strategic’ council land to private developers, and another to publish all viability assessments used by private developers to calculate their ability to provide affordable homes. And ballots for any estate regeneration that includes replacing existing homes.
There’s a reason these policies proved popular – Lewisham is one of the boroughs at the sharp end of London’s housing crisis. It’s not the capital’s most glamorous area, but it has still seen prices rising, gentrification and has 10,000 people on its waiting list.
A National Housing Federation report found that almost 6,800 too few homes were built in the borough from 2012 to 2016, and nearly a third of residents were in full-time work, on housing benefit and still couldn’t afford their rent.
Social landlords in the area that Inside Housing speaks to are effusive about Mr Egan – who they have worked with since he became cabinet member for housing in 2014.
“He’s very dynamic and passionate about the job and about getting the best he can for the citizens of Lewisham,” says Jim Ripley, chief executive of Phoenix Community Housing, a 6,000-home association headquartered in the borough. (Phoenix has just finished its first new build homes – a £12.7m extra care scheme, Hazelhurst Court, which was partly funded by the council. Lewisham also has two representatives on its board.)
It’s all a bit of a housing love-in. Talking about how he felt when he was asked to take on the housing role in the last administration’s cabinet, Mr Egan says he was “delighted”. This is partly due to a passion for solving the housing crisis but also, pragmatically, in a time when councils are facing dramatic cuts and rising land values, housing is one area where “you’ve still got room to do things”.
So how is he going to implement all these policies? When it comes to that big housebuilding target, the council already has sketched in where it wants to build (and is also buying up existing homes to add stock). The plans double the 500-home target of the last mayor.
Social landlords in the area are effusive about Mr Egan
“Yes, it is very ambitious, but we believe that we can do that in the course of this administration,” Mr Egan says. The borough’s ALMO, Lewisham Homes, will be the development manager, in charge of delivering the homes. Most will be on smaller sites, although none are infill on council estates.
At the time of the interview, Mr Egan was just about to make a bid for £100m of funding from the Greater London Authority.
Whereas other social landlords have been cross-subsidising with market sale, Mr Egan is determined the council will not. “If it was our land as an individual, we probably wouldn’t sell it – we’d be looking at long-term solutions, so that’s the approach we’ve got to have,” he argues.
His answer is to build to rent for the private market, which instead creates another “long-term revenue stream” for the council. This will be differentiated from existing build-to-rent developments aimed at the top end of the market with concierges, gyms and expensive facilities. A first development will have 240 homes, mostly at a ‘standard’ market rent, and including 30% at the ‘Lewisham Living Rent’ – basically the London Living Rent recalculated for the borough.
Return of Lewisham community housing projects
Lewisham was the home of the radical self build movement in the 1980s, with the council making land available to get projects off the ground. Now these pioneering developments, like Walters Way in one of Lewisham’s leafier and more affluent areas, are premium homes, having long since been sold under the Right to Buy.
Lewisham Council is now going back to these roots, and has supplied land for two community land trust (CLT) housing projects. One got through planning in June – designed by the esoterically named Rural Urban Synthesis Society – which was so oversubscribed that a draw was held in Lewisham Town Hall for the chance to buy up to an 80% stake in one of the 33 homes.
A second CLT in Sydenham is at an earlier stage and won’t be a self build. The CLT structure means that the projects should be kept as affordable housing. “We want to keep them owned by the community in perpetuity,” Mr Egan says.
The key, though, will be 10-year tenancies and rent control included in the contracts. “It’s about giving security,” Mr Egan says. “If you’ve got a child, your child will be in school for seven years, so you want to make sure that as a family you can get your kids through school in the same house.”
If the experiment is successful, Mr Egan says council-owned, private rented homes will be incorporated in future regeneration projects. The profits, he says, won’t equal those of a private project, but “we can demonstrate that it pays for itself and then we can plough any money back into affordable housing”.
So how about those tenant ballots? It’s obviously Labour’s national policy, and Mr Egan is seen as a centrist not a Corbynite. But he sees the need.
The mayor was recently approached by residents on a regeneration project, three years into the planning of it. “They were asking me questions like: ‘will I still be able to live in this development? Will I still be able to keep the spare room that I’ve got?’ Questions that should have been answered right from the beginning, and not just a verbal agreement but really concrete assurances.”

The first regeneration project to be put to the test of a resident ballot is being planned at the moment in New Cross at the Achilles Street Estate, close to Goldsmiths College, and Mr Egan says he’s looking forward to seeing how the ballot shapes the project.
That said, the policy will be reviewed at the end of his four-year term. “The reason being if we were getting successive no vote, no vote, no vote, then obviously we’d have to ask questions, because we need more council housing. There’s 10,000 families in Lewisham on the housing waiting list.”
"When you’re living in a house share in your 30s, you know that’s not a healthy way that anyone wants to live.”
Asked about what separates him from his predecessor – Labour’s Sir Steve Bullock, who held the post from when the elected mayor position was introduced in 2002, until he stood down and Mr Egan was elected this year – he talks more in terms of continuity than a break from the past.
But he says there is a generational difference.
“I think you’ve had generations of politicians who maybe haven’t experienced housing issues. And actually the new generation coming through in London [have] not just childhood memories, it’s lived experiences,” he says. “I’ve been in loads of different house shares – and been in some lovely places, been in some terrible ones. But even in the lovely places when you’re living in a house share in your 30s, you know that’s not a healthy way that anyone wants to live.”
Temporary accommodation spending in the last five years by local authority
| Council | 2017/18 | 2016/17 | 2015/16 | 2014/15 | 2013/14 | Notes |
|---|---|---|---|---|---|---|
| Adur | £874,660.00 | £708,133.00 | £616,050.00 | £625,301.00 | £683,066.00 | |
| Allerdale | £47,324.00 | £55,259.00 | £53,192.00 | £58,617.00 | £57,278.00 | |
| Amber Valley | £11,665.90 | £1,896.00 | £3,906.00 | £2,140.00 | £3,945.00 | |
| Arun | £776,648.98 | £457,579.16 | £314,321.98 | £366,726.31 | £408,110.48 | |
| Ashfield | £43,232.89 | £52,907.41 | £122,765.33 | £231,410.57 | £164,364.86 | |
| Babergh | £155,059.00 | £150,474.00 | £212,953.00 | £149,031.00 | £103,647.00 | |
| Barking and Dagenham | £21,665,000.00 | £19,816,000.00 | £17,875,000.00 | £16,570,000.00 | £15,643,000.00 | |
| Barnet | £24,329,556.88 | £24,818,229.29 | £20,912,991.00 | £16,207,163.00 | £13,346,853.00 | |
| Barnsley | £40,316.58 | £30,323.59 | £39,987.77 | £76,028.90 | £60,395.18 | |
| Barrow-in-Furness | £152,227.98 | £162,102.77 | £178,175.26 | £149,664.74 | £152,365.14 | |
| Basildon | £26,106.00 | £7,364.00 | £131,963.00 | £1,251,583.00 | £290,037.00 | |
| Basingstoke and Deane | £34,589.00 | £50,241.92 | £45,295.26 | £114,406.48 | £78,872.61 | |
| Bassetlaw | £36,504.10 | £38,423.76 | £14,458.42 | £30,123.60 | £8,491.13 | |
| Bath and North East Somerset | £217,350.00 | £217,350.00 | £217,350.00 | £217,350.00 | Now commissioned by Virgin Care | |
| Bedford | £1,352,549.00 | £967,777.00 | £715,647.00 | £656,637.00 | £634,291.00 | |
| Bexley | £10,363,558.30 | £8,112,526.18 | £6,039,462.96 | £4,807,068.56 | £3,300,567.72 | |
| Birmingham | £22,978,867.00 | £17,226,520.00 | £10,511,777.00 | £9,715,817.00 | £8,831,337.00 | |
| Blaby | £24,404.09 | £10,772.96 | £18,642.30 | £3,853.00 | £5,787.45 | |
| Blackburn with Darwen | £59,818.00 | £60,704.00 | £55,321.50 | £52,758.82 | £59,073.17 | |
| Blackpool | £408,009.00 | £398,099.00 | £360,415.00 | £313,765.00 | £312,882.00 | |
| Bolsover | £8,509.00 | £10,384.00 | £14,619.00 | £10,281.00 | £12,330.00 | |
| Boston | £13,826.00 | £23,176.00 | £27,964.00 | £27,391.00 | £30,018.00 | |
| Bournemouth | £197,889.00 | £133,047.00 | £32,968.00 | £271,209.00 | £115,831.00 | |
| Bracknell Forest | £777,999.00 | £718,087.00 | £923,962.00 | £531,032.00 | £112,368.00 | |
| Bradford | £974,417.47 | £803,107.00 | £625,150.00 | £715,910.00 | £859,603.00 | |
| Braintree | £75,453.44 | £43,030.50 | £33,396.04 | £33,097.85 | £35,951.05 | |
| Brent | £37,916,000.00 | £35,774,000.00 | £22,174,000.00 | £23,990,000.00 | £18,927,000.00 | |
| Brighton and Hove | £16,531,066.00 | £14,074,713.00 | £12,817,416.00 | £11,435,616.00 | £10,666,457.00 | |
| Broadland | £424,453.00 | £521,318.00 | £526,159.00 | £445,328.00 | £388,300.00 | |
| Bromley | £15,922,834.00 | £14,510,836.00 | £12,591,934.00 | £9,030,441.00 | £7,044,048.00 | |
| Bromsgrove | £27,734.45 | £11,042.47 | £13,923.92 | £19,019.81 | £13,880.53 | |
| Broxbourne | £868,983.84 | £522,372.09 | £192,683.06 | £160,363.31 | £270,389.39 | |
| Broxtowe | £38,376.00 | £20,798.00 | £10,850.00 | £15,946.00 | £22,621.00 | |
| Burnley | £40,442.00 | £17,526.00 | £19,048.00 | £21,613.00 | £49,543.00 | |
| Calderdale | £510,801.04 | £599,920.72 | £488,686.24 | £504,820.98 | £547,851.21 | |
| Cambridge | £441,794.85 | £618,861.71 | £884,756.13 | £767,220.43 | £875,218.36 | |
| Camden | £14,299,348.36 | £14,521,190.74 | £14,917,721.64 | £16,789,863.17 | £17,795,987.49 | |
| Cannock Chase | £40,983.00 | £19,844.00 | £22,415.00 | £39,086.00 | £46,445.00 | |
| Canterbury | £482,932.20 | £311,989.29 | £383,002.92 | £134,877.32 | £87,461.56 | |
| Carlisle | £45,520.00 | £0.00 | £0.00 | £0.00 | £113,804.00 | |
| Central Bedfordshire | £2,075,680.00 | £935,444.00 | £1,070,780.00 | £225,551.00 | £74,644.00 | |
| Charnwood | £201,990.64 | £130,599.10 | £36,637.81 | £56,895.47 | £88,913.59 | |
| Chelmsford | £4,233,000.00 | £3,473,000.00 | £2,373,000.00 | £1,634,000.00 | £1,514,000.00 | |
| Cheltenham | £37,347.00 | £34,742.00 | £57,173.00 | £25,932.00 | £3,423.00 | Data only provided for last quarter of 2013/14 |
| Cherwell | £80,488.67 | £27,883.97 | £55,826.77 | £52,774.56 | £49,003.26 | |
| Cheshire East | £130,920.65 | £153,084.84 | £186,326.89 | £194,540.25 | £113,654.80 | |
| Cheshire West and Chester | £396,376.00 | £266,952.00 | £417,319.00 | £366,042.00 | £244,579.00 | |
| Chesterfield | £32,525.24 | £32,422.80 | £80,352.88 | £70,654.17 | £65,563.95 | |
| Chichester | £120,634.31 | £73,167.97 | £125,084.76 | £50,237.00 | £49,982.36 | |
| Chiltern | £230,000.00 | £173,000.00 | £108,000.00 | £60,857.00 | £7,823.00 | |
| Chorley | £354,848.00 | £285,760.00 | £304,353.00 | £307,837.00 | £320,841.00 | |
| Christchurch | £25,231.19 | £24,432.00 | £21,500.77 | £117,671.79 | £108,760.33 | |
| City of London | £280,958.00 | £311,630.00 | £304,737.00 | £121,607.00 | £190,703.00 | |
| Colchester | £397,174.00 | £914,502.00 | £546,042.00 | £307,017.00 | £418,856.00 | |
| Copeland | £54,537.00 | £55,844.00 | £62,736.00 | £58,878.00 | £57,910.00 | |
| Corby | £278,427.67 | £101,511.76 | £78,989.28 | £74,027.56 | £104,100.16 | |
| Cornwall | £2,784,506.00 | £2,026,425.00 | £2,350,325.00 | £2,758,313.00 | £2,988,298.00 | |
| Cotswold | £9,927.74 | £63,370.72 | £18,755.20 | £23,927.60 | £27,108.22 | |
| County Durham | £76,825.00 | £10,343.00 | £16,011.00 | £6,581.00 | £19,036.00 | |
| Coventry | £4,103,000.00 | £2,896,000.00 | £1,365,000.00 | £808,000.00 | £573,000.00 | |
| Craven | £90,487.31 | £109,826.00 | £127,300.00 | £72,675.00 | £99,946.00 | |
| Crawley | £613,442.20 | £1,321,235.70 | £1,268,230.10 | £1,284,887.02 | £1,404,396.97 | |
| Croydon | £32,852,248.00 | £26,833,337.00 | £20,504,639.00 | £17,691,805.00 | £13,909,313.00 | |
| Dacorum | £514,595.58 | £521,308.53 | £554,669.10 | £485,771.73 | £519,612.57 | |
| Darlington | £113,725.00 | £139,072.00 | £131,759.00 | £151,203.00 | £148,664.00 | |
| Dartford | £2,927,059.91 | £2,360,522.60 | £1,655,639.04 | £1,195,446.33 | £936,853.98 | |
| Daventry | £168,637.00 | £82,667.00 | £67,026.00 | £27,535.00 | £34,173.00 | |
| Derbyshire Dales | £12,408.00 | £16,750.84 | £13,851.16 | £6,157.79 | £4,234.75 | |
| Doncaster | £229,824.87 | £112,445.38 | £48,299.72 | £186,641.84 | Data for 2013/14 not provided | |
| Dover | £965,371.00 | £460,672.00 | £235,034.00 | £208,677.00 | £143,317.00 | |
| Dudley | £40,642.89 | £18,498.42 | £39,264.35 | £63,903.19 | £40,428.88 | |
| Ealing | £37,173,488.00 | £39,634,439.00 | £40,448,624.00 | £37,759,310.00 | £31,225,393.00 | |
| East Cambridgeshire | £0.00 | £0.00 | £0.00 | £8,819.71 | £123,201.06 | |
| East Devon | £219,024.13 | £77,115.35 | £19,401.09 | £19,621.02 | £55,749.58 | |
| East Dorset | £48,970.67 | £32,719.35 | £22,748.04 | £17,151.75 | £55,888.21 | |
| East Hampshire | £53,570.00 | £67,847.00 | £42,991.00 | £78,352.00 | £19,396.00 | |
| East Hertfordshire | £212,831.56 | £222,663.70 | £220,956.00 | £246,072.00 | £214,549.00 | |
| East Northamptonshire | £22,398.00 | £15,254.00 | £6,199.00 | £11,678.00 | £22,923.00 | |
| East Riding of Yorkshire | £72,349.90 | £312,723.29 | £267,379.00 | £338,425.03 | £231,885.52 | |
| East Staffordshire | £244,975.01 | £180,126.64 | £134,676.87 | £118,819.97 | £54,617.21 | |
| Eastbourne | £1,256,328.36 | £898,051.89 | £377,236.29 | £250,629.86 | £171,969.17 | |
| Eastleigh | £72,469.00 | £95,606.00 | £149,607.00 | £216,993.00 | £190,813.00 | |
| Eden | £19,354.10 | £12,365.20 | £8,988.81 | £14,854.45 | £25,008.24 | |
| Elmbridge | £240,808.00 | £224,945.00 | £139,053.00 | £47,892.00 | £155,575.00 | |
| Enfield | £49,898,406.00 | £43,653,477.00 | £39,447,514.00 | £32,443,071.00 | £26,464,592.00 | |
| Epping Forest | £725,306.00 | £528,611.00 | £610,560.00 | £571,801.00 | £523,497.00 | |
| Erewash | £79,608.00 | £78,176.47 | £79,238.77 | £86,867.75 | £68,643.12 | |
| Exeter | £218,435.00 | £122,808.00 | £104,535.00 | £430,474.00 | £288,878.00 | |
| Fareham | £1,011,485.42 | £953,776.96 | £853,349.52 | £709,959.20 | £827,496.36 | |
| Fenland | £19,869.61 | £41,469.29 | £24,069.60 | £33,730.60 | £20,217.98 | |
| Folkestone and Hythe | £1,118,435.04 | £552,512.81 | £588,467.54 | £373,029.94 | £271,225.68 | |
| Forest Heath | £86,539.00 | £13,086.00 | £7,896.00 | £49,180.00 | £15,281.00 | |
| Forest of Dean | £6,953.08 | £26,135.02 | £28,482.12 | £24,761.78 | £11,342.84 | |
| Fylde | £36,589.00 | £42,127.00 | £39,708.00 | £21,805.00 | £47,087.00 | |
| Gateshead | £116,942.00 | £107,752.00 | £61,998.00 | £76,379.00 | £151,544.00 | |
| Gedling | £99,414.66 | £49,546.72 | £60,887.24 | £49,756.93 | £44,557.92 | |
| Gloucester | £712,985.00 | £538,032.00 | £169,018.00 | £185,570.00 | £179,283.00 | |
| Gravesham | £69,469.00 | £9,840.00 | £13,010.00 | £114,820.00 | £32,080.00 | |
| Great Yarmouth | £139,242.53 | £125,338.11 | £660,871.84 | £1,100,051.74 | £1,175,802.34 | |
| Greenwich | £7,154,470.00 | £6,458,114.00 | £5,659,620.00 | £4,506,916.00 | £3,190,510.00 | |
| Guildford | £82,615.00 | £35,181.00 | £33,737.00 | £51,219.00 | £63,410.00 | |
| Hackney | £54,774,812.00 | £41,731,301.00 | £35,198,856.00 | £26,342,844.00 | £25,593,750.00 | |
| Halton | £948,530.00 | £948,530.00 | £948,530.00 | £1,191,717.00 | £1,289,056.00 | |
| Hambleton | £45,267.02 | £59,179.99 | £42,594.34 | £35,483.47 | £67,323.59 | |
| Hammersmith and Fulham | £1,622,396.00 | £3,332,026.00 | £1,998,037.00 | £1,254,730.00 | £953,512.00 | |
| Harborough | £65,896.00 | £30,480.00 | £31,000.00 | £4,790.00 | £10,264.00 | |
| Haringey | £38,889,000.00 | £38,262,000.00 | £38,121,000.00 | £32,730,000.00 | £28,324,000.00 | |
| Harlow | £2,860,894.00 | £4,183,149.00 | £4,031,055.00 | £2,839,693.00 | £1,207,935.00 | |
| Harrogate | £266,674.15 | £280,859.62 | £288,845.09 | £236,944.27 | £296,713.09 | |
| Harrow | £2,860,894.00 | £4,183,149.00 | £4,031,055.00 | £2,839,693.00 | £1,207,935.00 | |
| Hart | £24,599.56 | £13,978.70 | £13,391.72 | £11,753.32 | £4,616.17 | |
| Hartlepool | £40,050.00 | £31,107.00 | £18,823.00 | £29,066.00 | £19,781.00 | |
| Hastings | £920,347.00 | £541,450.53 | £315,343.37 | £326,601.88 | £240,051.79 | |
| Havant | £144,766.74 | £130,316.34 | £190,754.87 | £109,926.80 | £60,904.33 | |
| Havering | £13,943,180.37 | £12,882,557.80 | £10,173,039.70 | £9,549,984.00 | £8,868,880.00 | |
| Herefordshire, County of | £331,612.00 | £231,997.00 | £200,445.00 | £257,618.00 | £348,315.00 | |
| Hertsmere | £1,539,607.00 | £1,222,824.00 | £1,155,428.00 | £950,301.00 | £751,054.00 | |
| High Peak | £9,488.11 | £6,871.05 | £3,091.15 | £4,373.53 | £6,257.34 | |
| Hillingdon | £5,376,284.83 | £6,167,869.55 | £5,963,004.38 | £5,943,805.29 | £7,304,346.41 | |
| Hinckley and Bosworth | £75,201.00 | £29,961.72 | £21,420.39 | £35,315.51 | £37,023.85 | |
| Horsham | £263,047.00 | £277,345.00 | £157,493.90 | £273,769.30 | £322,849.00 | |
| Hounslow | £8,053,255.83 | £11,236,190.65 | £14,312,373.74 | £14,191,432.40 | £13,171,032.49 | |
| Huntingdonshire | £940,739.00 | £659,641.00 | £334,919.00 | £438,659.00 | £434,098.00 | |
| Ipswich | £760,897.00 | £795,095.00 | £633,592.00 | £556,884.00 | £406,862.00 | |
| Islington | £9,221,181.89 | £10,339,750.77 | £11,045,545.59 | £11,673,573.79 | £11,362,436.10 | |
| Kensington and Chelsea | £33,643,101.00 | £30,743,532.00 | £27,500,428.00 | £25,130,429.00 | £21,900,504.00 | |
| Kettering | £1,134,146.00 | £498,055.00 | £196,600.00 | £191,455.00 | £224,003.00 | |
| King's Lynn and West Norfolk | £16,731.00 | £41,032.85 | £13,397.50 | £19,416.43 | £8,090.79 | |
| Kingston upon Hull, City of | £98,147.60 | £105,730.00 | £123,860.00 | £101,666.62 | £105,211.98 | |
| Kingston upon Thames | £7,838,499.00 | £8,267,672.00 | £6,452,073.00 | £5,805,790.00 | £5,714,246.00 | |
| Kirklees | £1,483,919.00 | £1,602,987.00 | £1,588,548.00 | £1,322,300.00 | £1,926,399.00 | |
| Knowsley | £111,129.00 | £88,641.00 | £107,038.00 | £59,480.00 | £118,033.00 | |
| Lambeth | £30,158,362.43 | £29,722,371.17 | £29,835,425.78 | £25,870,429.56 | £17,891,109.35 | |
| Lancaster | £21,541.00 | £24,868.00 | £25,750.00 | £46,201.00 | £44,312.00 | |
| Lewes | £647,629.00 | £541,366.00 | £901,891.00 | £837,729.00 | £872,709.00 | |
| Lewisham | £24,751,651.00 | £22,752,258.00 | £25,778,399.00 | £22,888,060.00 | £14,833,177.00 | |
| Lichfield | £14,258.95 | £20,293.90 | £12,364.84 | £12,947.89 | £5,174.41 | |
| Lincoln | £183,480.00 | £125,478.00 | £148,790.00 | £245,919.00 | £164,030.00 | |
| Liverpool | £7,016,500.00 | £7,609,730.00 | £9,124,003.00 | £9,772,495.00 | £9,827,656.00 | |
| Luton | £14,369,605.00 | £14,662,783.00 | £11,125,176.00 | £9,205,210.00 | £8,174,603.00 | |
| Maidstone | £1,160,924.00 | £1,542,401.00 | £1,188,421.00 | £856,584.00 | £623,069.00 | |
| Maldon | £34,636.83 | £14,092.38 | £13,701.00 | £19,575.66 | £6,609.09 | |
| Manchester | £20,419,679.00 | £14,862,171.00 | £11,117,513.00 | £11,561,147.00 | £11,740,326.00 | |
| Mansfield | £406,241.00 | £320,305.00 | £367,749.00 | £373,863.00 | £358,172.00 | |
| Melton | £38,698.59 | £65,697.03 | £112,153.87 | £102,315.35 | £56,421.00 | |
| Mendip | £14,623.13 | £36,605.61 | £88,604.51 | £106,874.21 | £62,862.68 | |
| Merton | £3,097,078.00 | £3,553,142.00 | £2,277,513.00 | £2,011,293.00 | £1,409,219.00 | |
| Mid Devon | £122,310.00 | £101,245.00 | £38,293.00 | £49,362.00 | £45,212.00 | |
| Mid Suffolk | £119,640.00 | £59,010.00 | £80,484.00 | £94,435.00 | £94,046.00 | |
| Mid Sussex | £346,346.00 | £254,070.00 | £131,619.00 | £66,646.00 | £105,141.00 | |
| Middlesbrough | £151,816.62 | £98,396.00 | £26,601.00 | £27,671.00 | £58,683.00 | |
| Milton Keynes | £5,161,265.00 | £4,168,819.00 | £2,378,087.00 | £979,884.00 | £1,025,512.00 | |
| Mole Valley | £111,362.00 | £126,951.00 | £67,231.00 | £52,398.00 | £32,296.00 | |
| New Forest | £1,702,902.18 | £1,303,204.20 | £1,439,875.14 | £1,333,198.00 | £1,014,099.00 | |
| Newark and Sherwood | £35,773.24 | £46,162.94 | £54,967.49 | £44,905.06 | £38,838.99 | |
| Newcastle upon Tyne | £633,895.00 | £600,685.00 | £681,339.00 | £610,945.00 | £657,560.00 | |
| Newcastle-under-Lyme | £53,222.31 | £51,142.21 | £45,179.76 | £31,475.59 | £30,699.60 | |
| Newham | £61,100,000.00 | £61,069,621.09 | £49,522,828.19 | £39,528,925.55 | £35,112,107.65 | 2017/18 is estimate as figure not provided |
| North Devon | £252,000.00 | £252,348.07 | £207,252.34 | £252,111.49 | £345,553.49 | 2017/18 is estimate as figure not provided |
| North East Derbyshire | £13,049.40 | £28,187.00 | £24,894.04 | £21,404.00 | £17,626.59 | |
| North East Lincolnshire | £320,844.00 | £303,578.00 | £218,401.00 | £195,603.00 | £157,133.00 | |
| North Hertfordshire | £33,740.72 | £75,712.62 | £284,230.34 | £141,297.45 | Data for 2013/14 not provided | |
| North Kesteven | £44,087.50 | £46,657.10 | £37,420.97 | £29,878.17 | £22,369.00 | |
| North Lincolnshire | £97,038.22 | £43,074.45 | £32,754.00 | £45,137.44 | £46,584.00 | |
| North Norfolk | £182,952.36 | £97,842.95 | £78,292.04 | £50,312.51 | £60,591.94 | |
| North Somerset | £54,929.00 | £18,166.00 | £10,393.00 | £28,045.00 | £75,500.00 | |
| North Tyneside | £222,104.49 | £235,438.77 | £248,057.86 | £283,190.61 | £327,625.19 | |
| North Warwickshire | £187,712.00 | £104,258.00 | £102,366.00 | £143,326.00 | £187,556.00 | |
| North West Leicestershire | £19,160.14 | £8,087.05 | £19,505.26 | £27,439.33 | £36,509.44 | |
| Northampton | £2,643,192.00 | £1,338,922.00 | £547,618.00 | £367,112.00 | £278,860.00 | |
| Northumberland | £197,407.00 | £210,974.00 | £252,203.00 | £249,835.00 | £241,250.00 | |
| Norwich | £193,735.00 | £290,171.00 | £178,900.00 | £146,109.00 | £145,288.00 | |
| Nottingham | £3,994,337.22 | £3,751,619.00 | £3,274,021.00 | £3,183,923.00 | £3,534,818.00 | |
| Nuneaton and Bedworth | £302,594.16 | £303,948.79 | £291,277.32 | £243,714.70 | ||
| Oadby and Wigston | £91,973.93 | £74,551.99 | £53,840.21 | £49,115.27 | £56,885.93 | |
| Oldham | £190,062.00 | £390,795.00 | £225,901.00 | £251,650.00 | £273,206.00 | Data only provided for first two quarters of 2017/18 |
| Oxford | £2,081,000.00 | £2,140,000.00 | £2,108,000.00 | £2,150,000.00 | £2,082,000.00 | Taken from official local authority expenditure stats on advice from council |
| Peterborough | £3,734,916.43 | £2,223,139.25 | £280,384.12 | £164,287.99 | £235,433.48 | |
| Plymouth | £1,132,788.00 | £675,234.00 | £473,777.00 | £329,130.00 | £46,245.00 | |
| Poole | £1,351,032.00 | £1,025,979.00 | £744,821.00 | £518,651.00 | £713,567.00 | |
| Portsmouth | £1,006,000.00 | £779,000.00 | £793,000.00 | £741,000.00 | £727,000.00 | |
| Preston | £88,696.00 | £63,773.46 | £54,448.00 | £54,465.00 | £53,984.00 | |
| Purbeck | £235,958.12 | £117,455.00 | £153,374.00 | £89,871.00 | £47,693.00 | |
| Reading | £1,000,000.00 | £1,587,818.00 | £1,547,010.00 | £1,316,579.00 | £569,239.00 | 2017/18 is estimate as figure not provided |
| Redbridge | £34,343,000.00 | £34,075,000.00 | £30,374,000.00 | £28,010,000.00 | £25,662,000.00 | |
| Redcar and Cleveland | £47,434.00 | £31,700.00 | £48,000.00 | £33,300.00 | £67,000.00 | |
| Reigate and Banstead | £117,000.00 | £234,000.00 | £563,000.00 | £461,000.00 | £204,000.00 | |
| Ribble Valley | £24,887.00 | £24,120.00 | £14,528.00 | £12,680.00 | £15,908.00 | |
| Richmond upon Thames | £4,841,000.00 | £4,663,000.00 | £4,318,000.00 | £4,390,000.00 | £4,561,000.00 | |
| Richmondshire | £176,459.69 | £131,840.21 | £121,979.85 | £52,925.04 | £83,839.73 | |
| Rochdale | £43,567.80 | £60,356.37 | £32,025.68 | £329,549.00 | 2015/16 figure not held by authority | |
| Rochford | £1,057,983.00 | £854,780.00 | £636,962.00 | £585,923.00 | £613,142.00 | |
| Rossendale | £31,135.00 | £11,460.00 | £20,565.00 | £12,236.16 | £3,639.83 | |
| Rother | £670,292.32 | £426,582.27 | £270,771.22 | £211,179.50 | £194,343.81 | |
| Rotherham | £119,944.02 | £83,266.59 | £77,701.67 | £75,623.15 | £110,883.33 | |
| Rugby | £709,420.00 | £560,660.00 | £384,151.00 | £205,343.00 | £98,610.00 | |
| Runnymede | £353,791.00 | £251,571.00 | £276,546.00 | £237,605.00 | £64,810.00 | |
| Rushcliffe | £143,152.00 | £142,970.00 | £160,906.00 | £133,612.00 | £174,661.00 | |
| Rushmoor | £93,157.01 | £68,726.09 | £137,115.47 | £172,592.61 | £250,815.91 | |
| Rutland | £20,000.00 | £13,000.00 | £18,000.00 | £15,000.00 | £20,000.00 | |
| Ryedale | £4,274.17 | £911.93 | £1,402.43 | £391.45 | £1,452.90 | |
| Sandwell | £729,648.78 | £412,546.40 | £443,834.45 | £397,660.41 | £232,158.42 | |
| Scarborough | £170,000.00 | £112,000.00 | £98,000.00 | £156,000.00 | £165,000.00 | |
| Sedgemoor | £79,043.00 | £70,512.00 | £85,326.00 | £94,449.00 | £67,663.00 | |
| Sefton | £144,788.47 | £203,594.38 | £159,449.65 | £177,835.67 | £172,293.79 | |
| Sevenoaks | £77,046.00 | £44,538.00 | £33,173.00 | £31,239.00 | £5,651.00 | |
| Sheffield | £72,033.00 | £35,836.00 | £21,235.00 | £39,024.00 | £177,441.00 | |
| Shropshire | £1,398,496.00 | £1,086,475.00 | £700,802.00 | £582,093.00 | £458,323.00 | |
| Slough | £3,137,672.00 | £2,996,415.00 | £2,316,124.00 | £839,543.00 | £643,008.00 | |
| Solihull | £44,202.70 | -£20,508.57 | £109,682.90 | £279,585.07 | £91,742.25 | Appear to be net figures: quering with authority |
| South Bucks | £944,000.00 | £920,000.00 | £464,000.00 | £176,091.00 | £166,025.00 | |
| South Cambridgeshire | £89,344.49 | £67,470.00 | £85,448.83 | £96,292.48 | £112,424.66 | |
| South Derbyshire | £141,585.76 | £66,884.87 | £57,399.90 | £111,772.41 | £91,866.41 | |
| South Gloucestershire | £1,148,000.00 | £1,107,000.00 | £868,000.00 | £1,118,000.00 | £910,000.00 | |
| South Hams | £130,353.68 | £70,668.98 | £78,529.31 | £129,099.21 | £203,778.10 | |
| South Holland | £39,141.94 | £7,272.32 | £15,123.75 | £1,973.65 | £3,456.99 | |
| South Kesteven | £45,437.00 | £25,104.00 | £7,079.00 | £53,053.00 | £44,961.00 | |
| South Lakeland | £210,288.31 | £95,655.45 | £36,915.85 | £19,824.69 | £40,061.98 | |
| South Norfolk | £67,614.66 | £129,591.97 | £102,174.16 | £107,946.73 | £88,973.42 | Data for last two months of 2017/18 not provided |
| South Northamptonshire | £80,488.67 | £27,883.97 | £55,826.77 | £52,774.56 | £49,003.26 | |
| South Oxfordshire | £22,272.00 | £58,978.00 | £61,860.00 | £66,727.00 | £106,228.00 | |
| South Ribble | £36,787.00 | £36,614.00 | £34,823.00 | £37,771.00 | £43,042.00 | |
| South Somerset | £7,617.00 | £14,544.00 | £11,112.00 | £8,588.00 | £22,567.00 | |
| Southampton | £92,544.00 | £89,739.00 | £56,942.00 | £72,607.00 | £69,238.00 | |
| Southend-on-Sea | £513,997.67 | £436,796.93 | £395,198.72 | £372,571.91 | £379,412.77 | |
| Southwark | £21,939,530.64 | £18,654,567.16 | £16,062,553.41 | £14,572,134.22 | £11,322,347.22 | |
| Spelthorne | £1,449,347.69 | £1,317,028.38 | £1,609,645.37 | £1,056,224.41 | £575,972.04 | |
| St Albans | £59,744.92 | £35,031.63 | £56,300.02 | £123,493.64 | £33,339.50 | |
| St Edmundsbury | £189,186.00 | £156,942.00 | £90,271.00 | £159,452.00 | £287,085.00 | |
| St. Helens | £8,461.67 | £13,921.07 | £41,422.04 | £6,339.29 | £1,663.96 | |
| Stafford | £72,472.39 | £47,565.62 | £66,834.95 | £24,969.08 | £46,317.02 | |
| Stevenage | £1,189,307.00 | £1,130,213.00 | £998,551.00 | £955,459.00 | £965,097.00 | |
| Stockport | £1,210,699.00 | £1,210,699.00 | £907,522.00 | £1,453,234.00 | £1,210,699.00 | |
| Stockton-on-Tees | £38,123.00 | £9,432.00 | £43,131.00 | £116,850.00 | £150,215.00 | |
| Stoke-on-Trent | £287,956.00 | £283,684.00 | £203,312.00 | £141,409.00 | £258,282.00 | |
| Stroud | £136,456.35 | £77,381.03 | £59,999.69 | £46,641.97 | £59,278.81 | |
| Suffolk Coastal | £92,228.43 | £27,105.02 | £17,758.98 | £25,872.27 | £20,657.09 | |
| Sunderland | £33,890.47 | £33,642.99 | £27,944.13 | £39,552.61 | £76,650.95 | |
| Surrey Heath | £29,170.00 | £57,610.00 | £55,065.00 | £43,702.00 | £109,084.00 | |
| Sutton | £1,058,719.23 | £1,201,114.00 | £649,866.98 | £415,980.83 | £231,565.51 | |
| Swale | £841,454.00 | £559,000.00 | £272,644.00 | £256,417.00 | £256,217.00 | |
| Swindon | £3,667,212.40 | £3,984,697.28 | £3,633,029.04 | £2,958,302.85 | £2,641,356.72 | |
| Tameside | £1,139,336.00 | £803,783.00 | £555,734.00 | £305,380.00 | £314,609.00 | |
| Tamworth | £262,390.71 | £438,545.25 | £273,407.64 | £211,587.77 | £87,927.02 | |
| Tandridge | £500.46 | £2,122.83 | £1,827.84 | £2,644.11 | £56.20 | |
| Teignbridge | £803,011.00 | £1,042,105.00 | £806,609.63 | £624,516.19 | £763,592.47 | |
| Telford and Wrekin | £1,508,582.21 | £946,439.45 | £771,324.72 | £726,772.04 | £913,835.57 | |
| Tendring | £338,980.00 | £303,092.00 | £103,308.00 | £71,382.00 | £22,368.00 | |
| Test Valley | £90,729.00 | £78,570.00 | £45,465.00 | £51,873.00 | £54,002.00 | |
| Thanet | £580,231.00 | £1,103,649.25 | £390,259.05 | £267,035.09 | £137,747.41 | |
| Three Rivers | £469,542.80 | £799,240.63 | £424,470.74 | £108,168.17 | £52,215.57 | |
| Tonbridge and Malling | £424,333.00 | £461,560.00 | £315,131.00 | £265,166.00 | £142,388.00 | |
| Torbay | £635,553.00 | £668,527.00 | £483,530.00 | £421,860.00 | £357,496.00 | |
| Torridge | £272,238.86 | £194,797.43 | £187,199.67 | £215,442.83 | £195,565.79 | |
| Tower Hamlets | £29,811,464.00 | £29,532,278.00 | £29,320,360.00 | £28,514,942.60 | £28,067,648.64 | |
| Trafford | £459,123.00 | £408,073.00 | £379,866.00 | £333,560.00 | £315,626.00 | |
| Tunbridge Wells | £332,472.00 | £260,310.00 | £249,040.00 | £216,893.00 | £259,754.00 | |
| Uttlesford | £39,283.00 | £87,642.00 | £68,531.33 | £41,505.62 | £43,961.15 | |
| Vale of White Horse | £35,544.00 | £20,773.00 | £55,201.00 | £71,883.00 | £140,278.00 | |
| Wakefield | £1,957,388.34 | £1,690,433.47 | £1,658,854.34 | £1,506,777.77 | £1,424,329.25 | |
| Walsall | £787,174.00 | £604,444.00 | £429,965.00 | £445,459.00 | £369,034.00 | |
| Waltham Forest | £30,716,066.82 | £30,344,776.77 | £31,582,673.13 | £27,455,351.00 | £21,490,211.76 | |
| Wandsworth | £15,740,857.51 | £12,548,455.02 | £11,020,839.17 | £9,001,584.13 | £4,622,202.02 | |
| Warrington | £50,416.00 | £106,335.00 | £61,259.00 | £31,995.00 | £41,916.00 | |
| Warwick | £62,948.00 | £151,156.00 | £84,309.00 | £36,638.00 | £75,523.00 | |
| Watford | £365,222.00 | £712,396.00 | £1,028,832.00 | £327,282.00 | £122,169.00 | |
| Waveney | £171,639.53 | £156,912.49 | £122,001.14 | £106,724.09 | £140,215.49 | |
| Waverley | £5,532.30 | £10,527.42 | £20,725.17 | £22,173.91 | £29,189.33 | |
| Wealden | £227,487.22 | £177,602.45 | £191,397.08 | £165,589.36 | £302,690.24 | |
| Welwyn Hatfield | £510,320.00 | £475,780.00 | £510,750.00 | £523,510.00 | £503,200.00 | |
| West Berkshire | £696,625.56 | £369,684.35 | £403,293.39 | £291,797.29 | £284,439.45 | |
| West Devon | £145,701.14 | £143,515.84 | £139,653.47 | £120,649.93 | £277,711.85 | |
| West Dorset | £109,000.00 | £109,126.70 | £89,512.63 | £108,274.30 | £41,797.51 | 2017/18 is estimate as figure not provided |
| West Lancashire | £30,720.00 | £30,720.00 | £36,090.00 | £36,090.00 | £36,090.00 | |
| West Lindsey | £21,287.97 | £9,898.73 | £27,697.47 | £32,505.96 | £41,949.97 | |
| West Oxfordshire | £106,516.09 | £116,006.50 | £68,655.23 | £107,830.88 | £47,332.75 | |
| Westminster | £48,025,000.00 | £46,458,000.00 | £45,610,000.00 | £39,189,000.00 | £42,271,000.00 | |
| Wigan | £335,803.00 | £249,554.00 | £205,629.00 | £248,302.00 | £238,451.00 | |
| Winchester | £319,249.00 | £280,549.00 | £239,690.00 | £238,074.00 | £237,006.00 | |
| Windsor and Maidenhead | £2,027,490.00 | £960,251.00 | £215,126.00 | £172,046.00 | £449,942.00 | |
| Wirral | £99,915.04 | £92,379.97 | £108,454.59 | £90,708.50 | £271,389.94 | |
| Woking | £346,745.00 | £560,815.00 | £470,659.00 | £549,458.00 | £245,388.00 | |
| Wokingham | £512,042.06 | £487,261.47 | £444,483.75 | £205,885.47 | £166,020.86 | |
| Wolverhampton | £969,697.57 | £875,576.00 | £885,657.46 | £800,047.39 | £989,424.19 | |
| Worcester | £448,181.84 | £304,006.79 | £253,323.94 | £285,604.65 | £136,846.28 | |
| Worthing | £1,349,188.00 | £1,070,126.00 | £313,459.00 | £253,473.00 | £232,073.00 | |
| Wychavon | £96,320.88 | £88,559.32 | £92,282.94 | £124,782.65 | £59,457.42 | |
| Wyre | £4,476.80 | £7,363.22 | £9,093.63 | £14,208.89 | £18,127.15 | |
| Wyre Forest | £85,278.78 | £71,784.16 | £38,540.96 | £48,703.13 | £50,819.77 | |
| York | £553,210.00 | £673,209.00 | £544,120.00 | £610,199.00 | £589,293.00 |
Source: Council responses to Inside Housing under the Freedom of Information Act
(FOIA data for Hackney, Camden, Bexley and Bromley councils provided by George Greenwood of the BBC)
At a glance: the different types of rent in London

Picture: Getty
Social rent: The amount of social rent a person pays depends on the location and size of the property, and is set according to a complex formula, but it is typically set at between 50% and 60% of market rent.
Affordable rent: Introduced by the coalition government in 2011, ‘affordable’ rent can be up to 80% of market rent, although many associations have been charging lower than this.
London Affordable Rent: A tenure introduced by Sadiq Khan that is lower than national affordable rent and based on target rent levels towards which social rents are gradually being raised. This makes it higher than average social rents in the capital, but in line with the rent that would likely be charged if a new social rent unit was built and set according to the same formula.
London Living Rent: A rental product aimed at middle-income Londoners introduced by Sadiq Khan, with rents set at one-third of average local earnings.
Target rent: A social rent level calculated by the government, which council and housing associations should use to move their social rents to over time.
AFFORDABLE HOUSING STARTS IN LONDON APRIL-JUNE 2018
- 630 London Living Rent/shared ownership
- 329 social rent
- 73 other affordable rent
- 65 affordable tenure to be confirmed
- 40 open market
Source: Greater London Authority


