You are viewing 1 of your 1 free articles

Jules Birch is an award-winning blogger who writes exclusive articles for Inside Housing
Letting housing benefit take the strain: how renters were priced out
Jules Birch delves into a report covering the past four decades which examines how lower-income households have been priced out of the housing market
Why has housing become so unaffordable over the past 40 years?
The answer, according to new report for the Joseph Rowntree Foundation (JRF), is cuts in housing subsidy that represent “a massive shift in who pays market housing costs, from government and landlords onto tenant” since 1979.
It’s the scale of the shift, rather than the shift itself, that is striking.
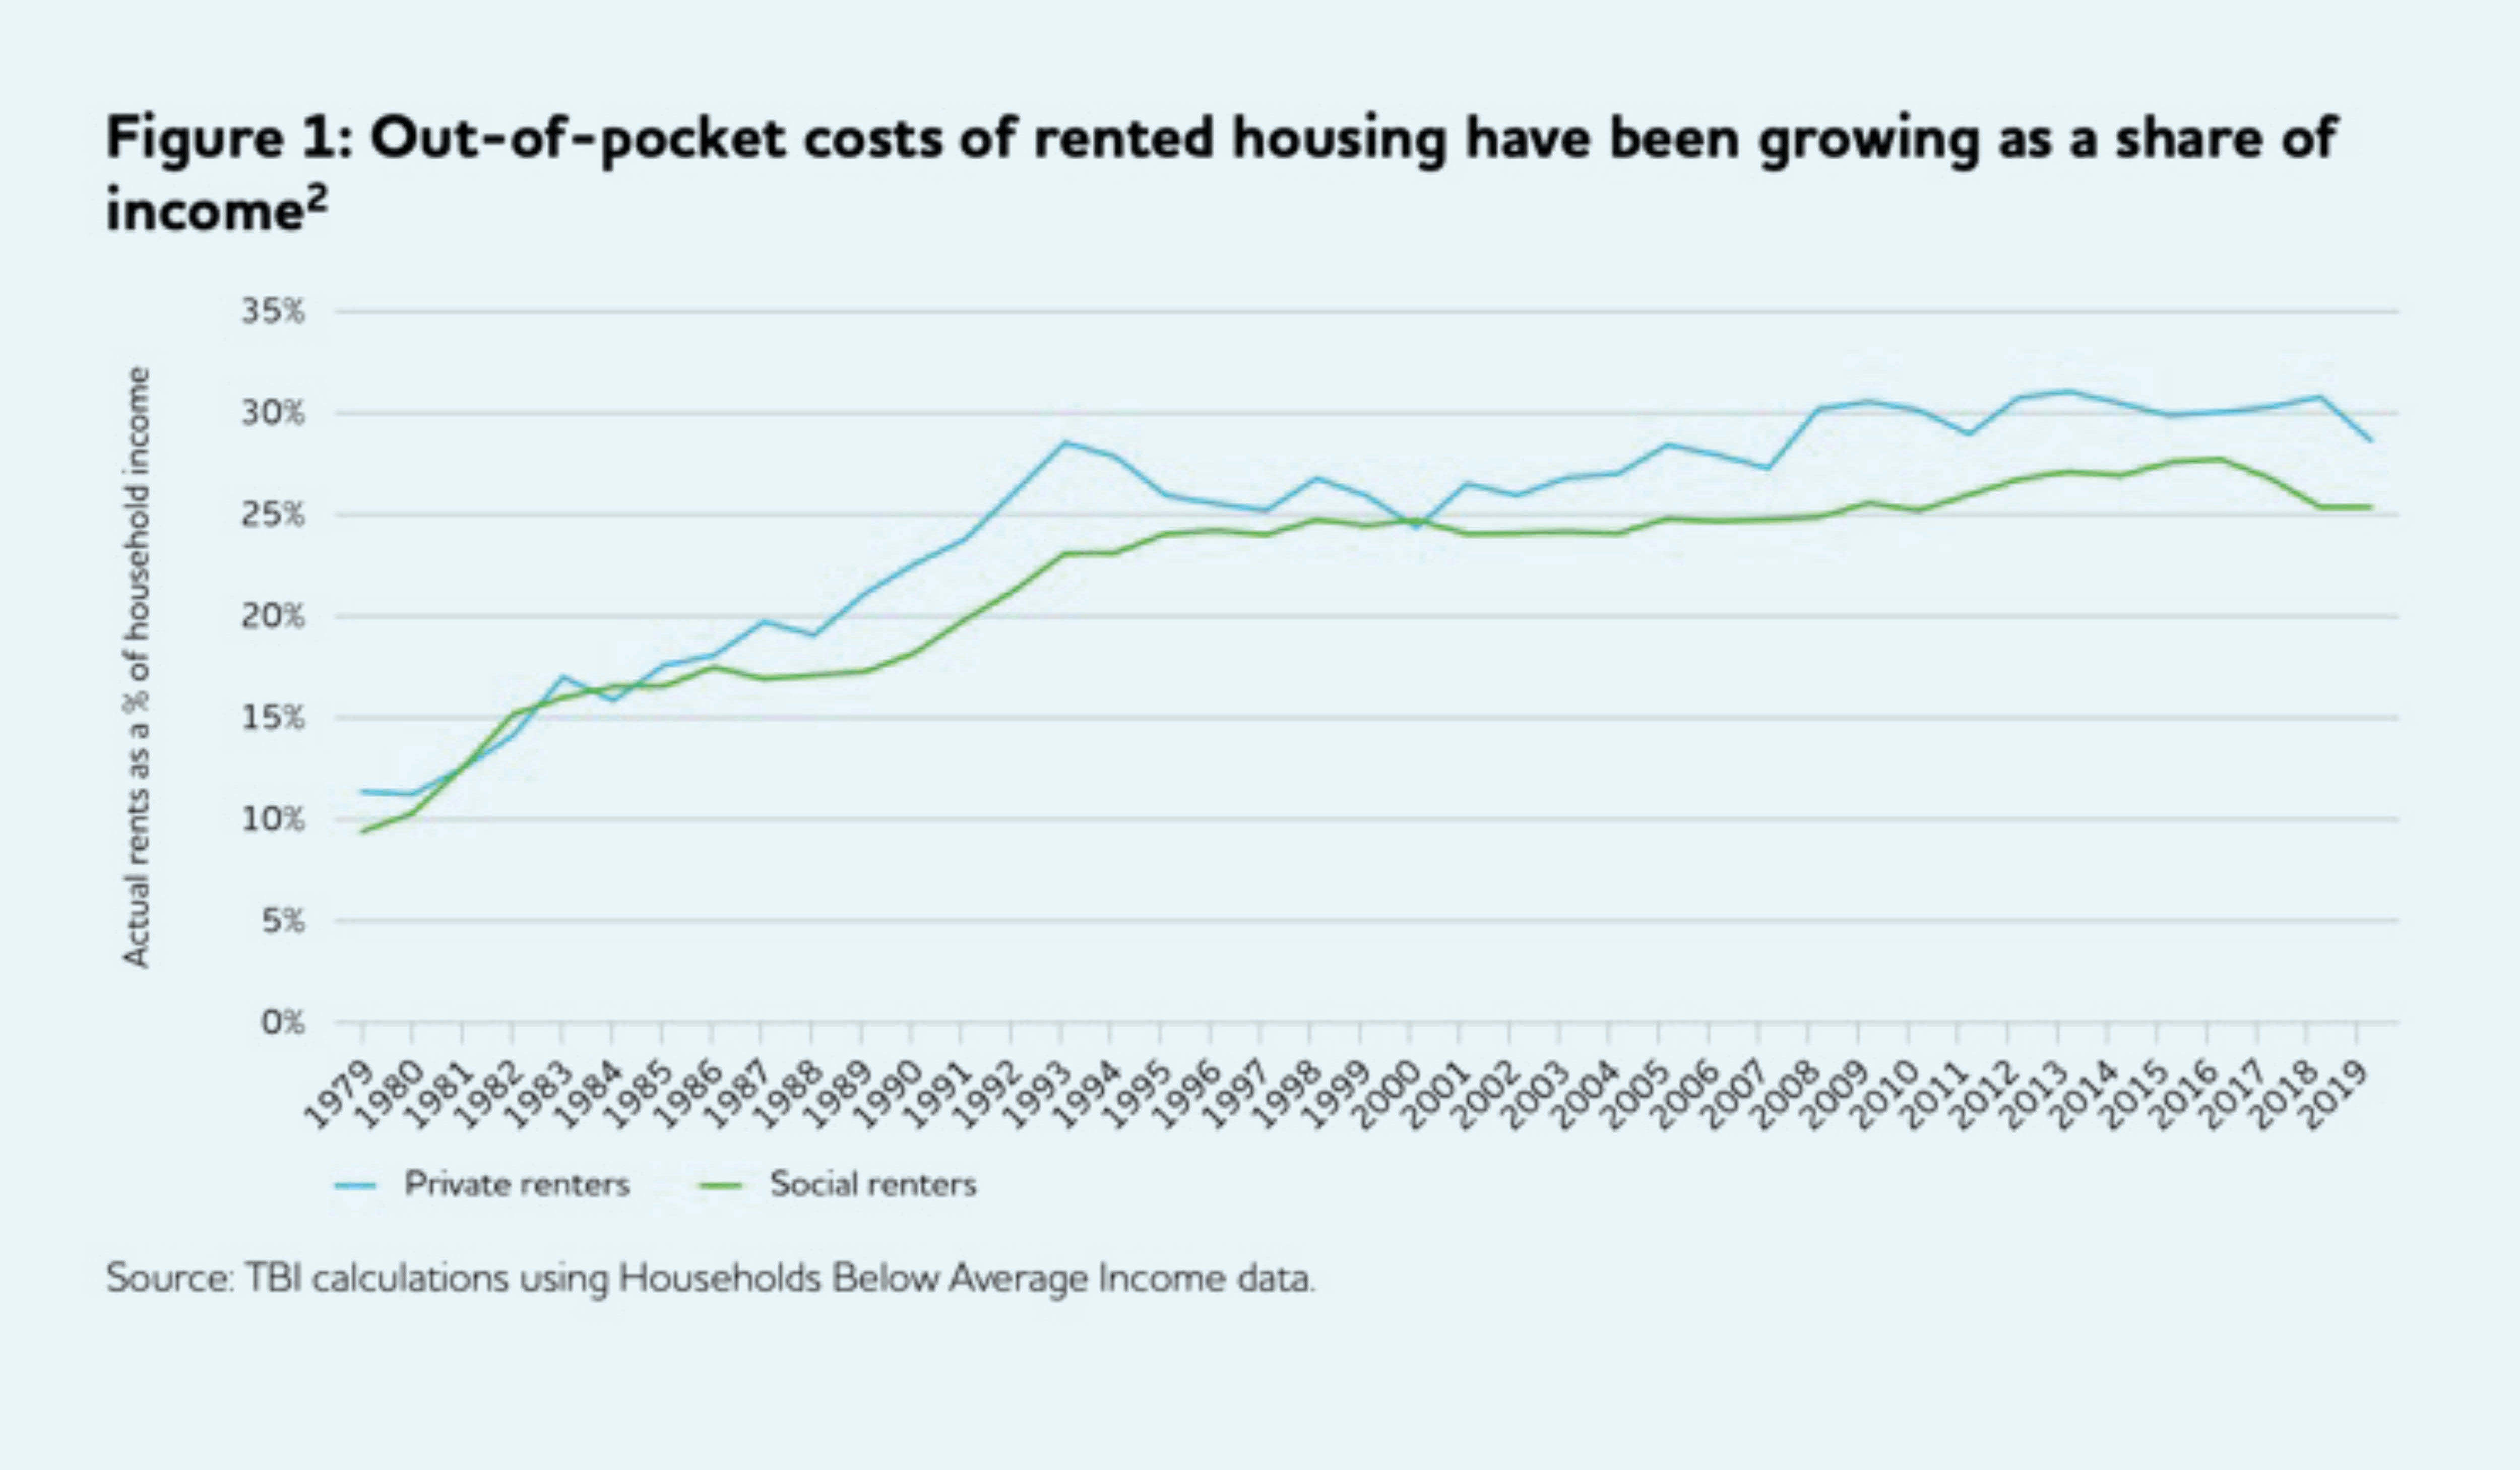
Back at the start of Margaret Thatcher’s first term, social and private renters alike were paying around 10 per cent of their incomes on rent. By 2020, that had risen to 25% for social renters and 30% for private renters.
The shift is represented in a graph that Ian Mulheirn, who co-authored the report with colleagues James Browne and Christos Tsoukalis from the Tony Blair Institute for Global Change, calls “one of the most striking” in public policy (see figure 1 below).
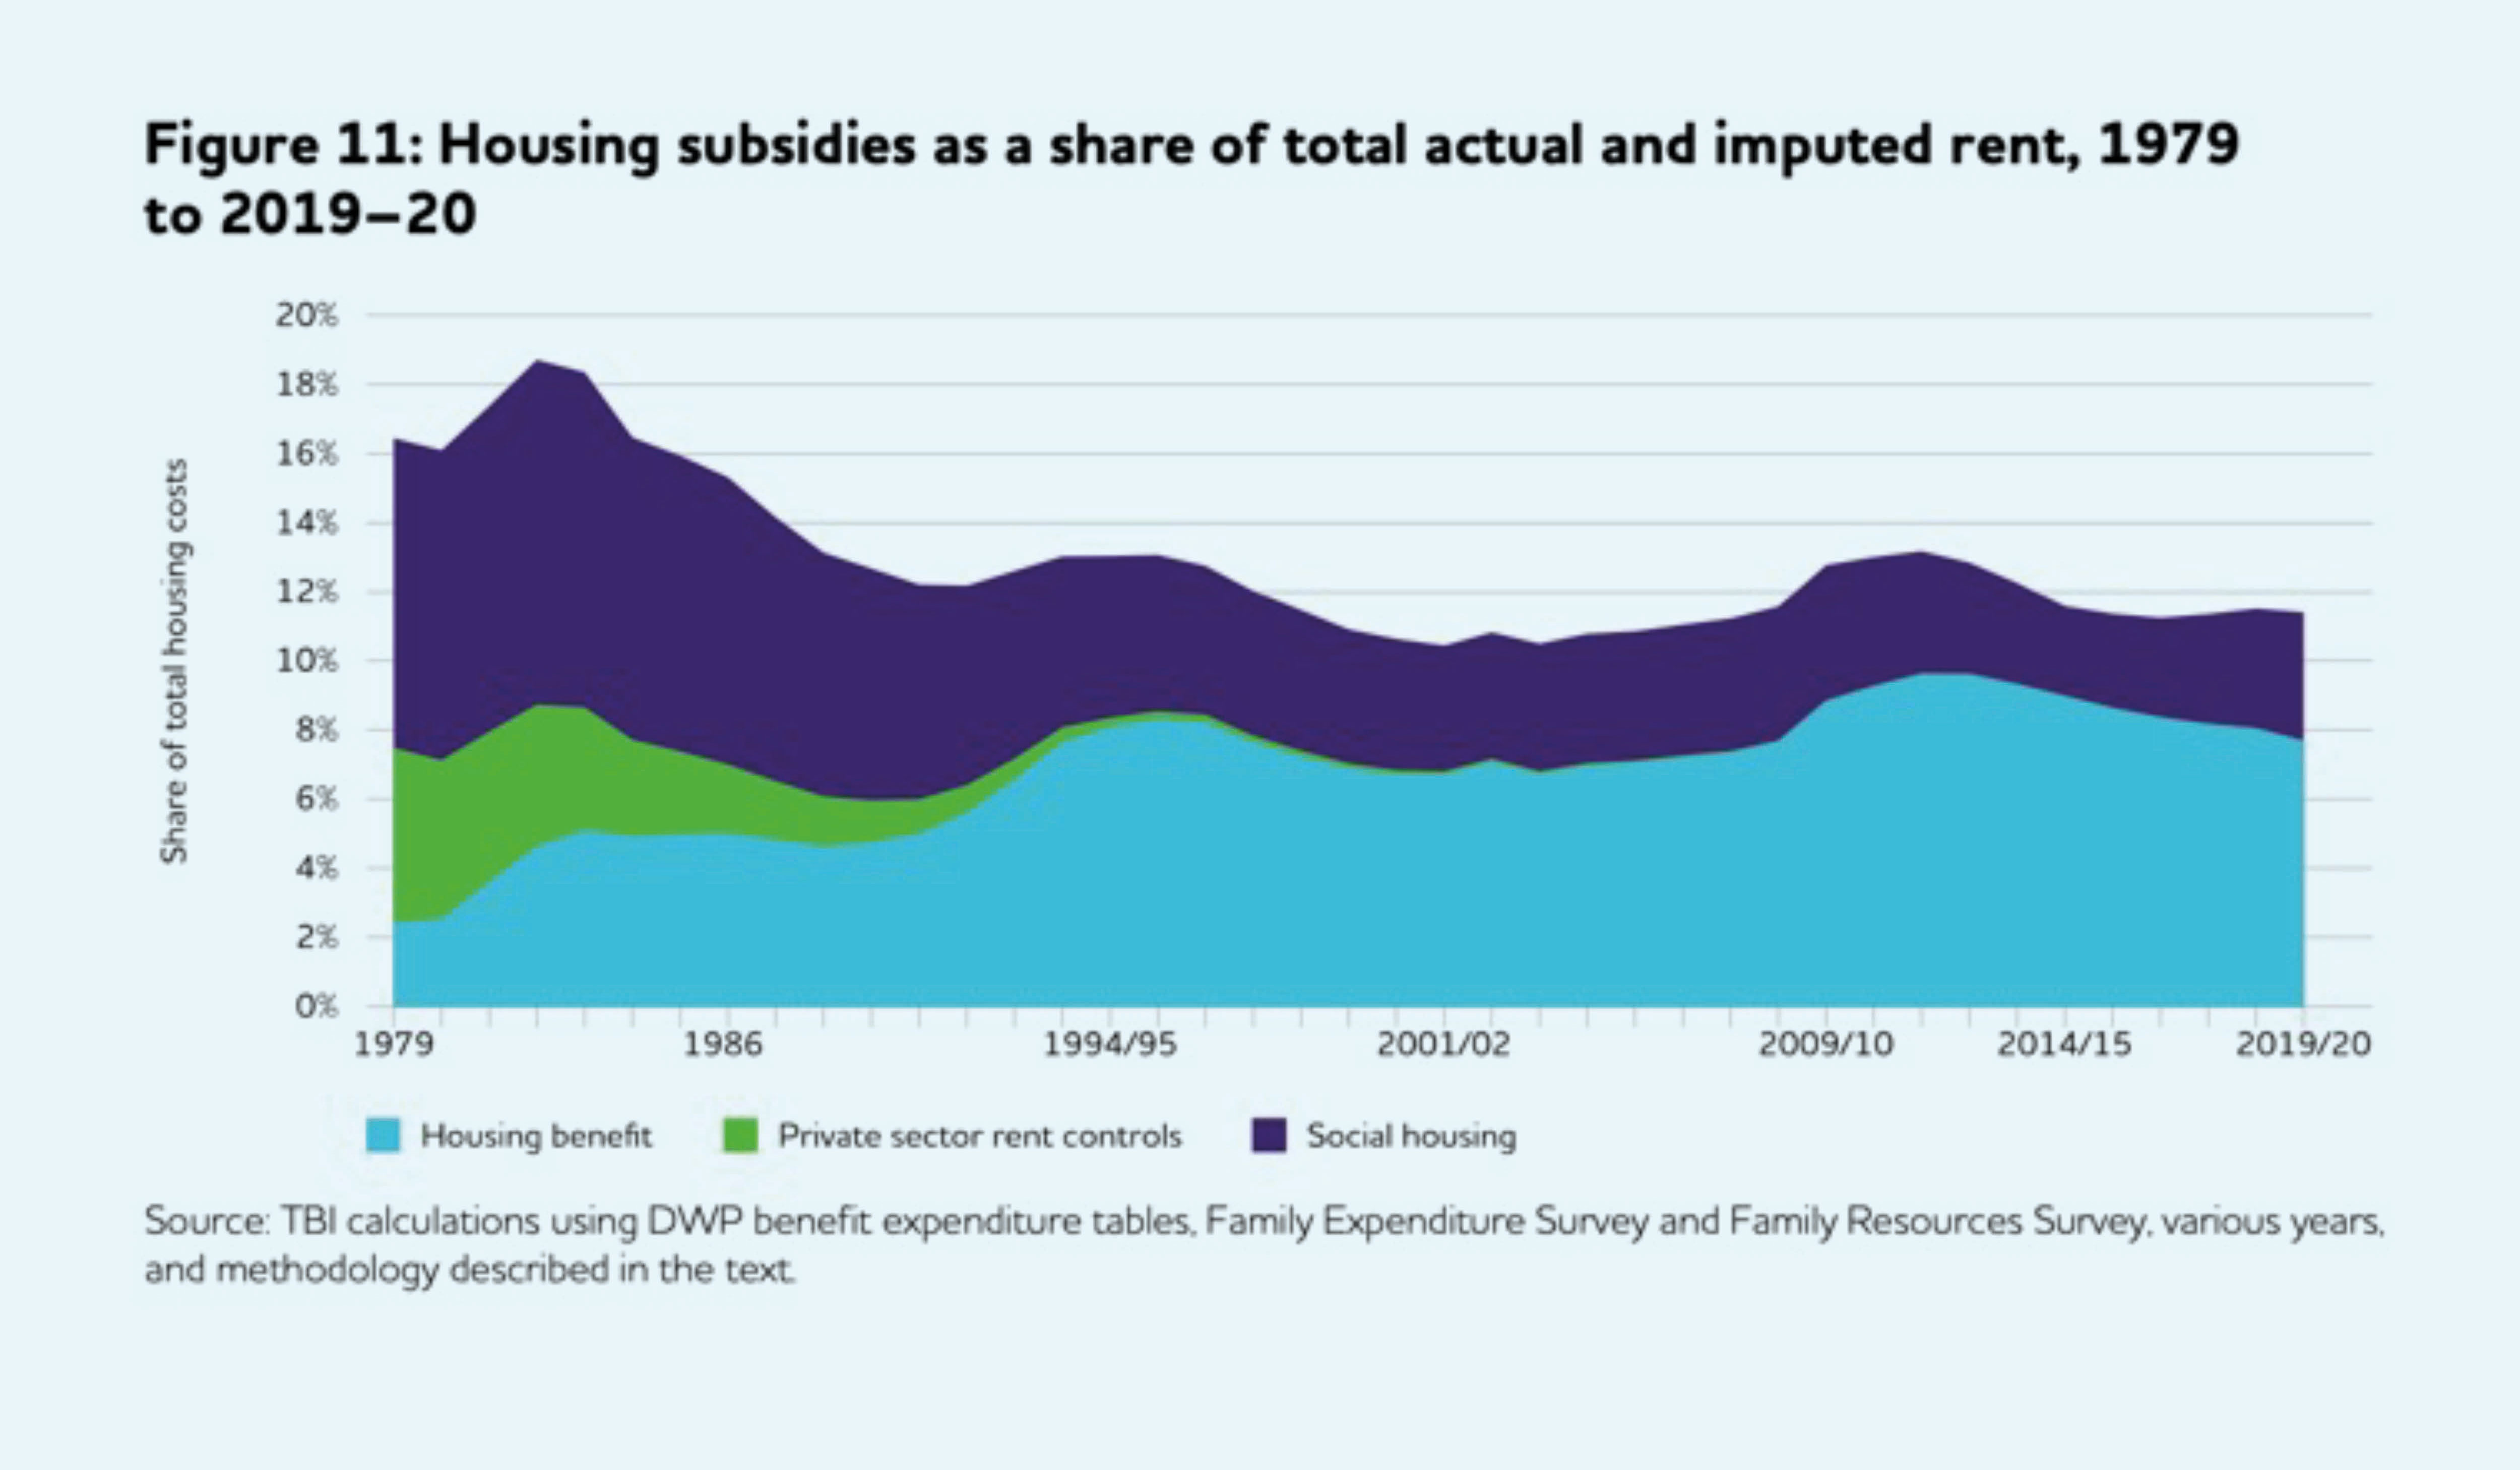
They calculate that if housing subsidies had been maintained at 1979 levels as a share of total housing costs, they would have been worth £45bn by 2019-20, rather than the actual £31bn.
This “generational housing costs squeeze” is the result of massive change in three elements of housing subsidy: social housing; housing benefit; and rent controls.
These stem from the accumulation of many different policies over time: cuts in council housing investment and higher council rents; private finance and higher housing association rents; the deregulation of the private rented sector; and rapid increases in housing benefit to “take the strain” of all that followed from the cuts imposed under austerity.
By looking at rental subsidy as a whole, the analysis also shines a light on government claims that housing benefit has been “out of control”. It’s true its cost has risen rapidly, but this directly results from reductions in the other subsidies. The next graph of subsidies as a share of total rent makes the point clearly (see figure 11 below).
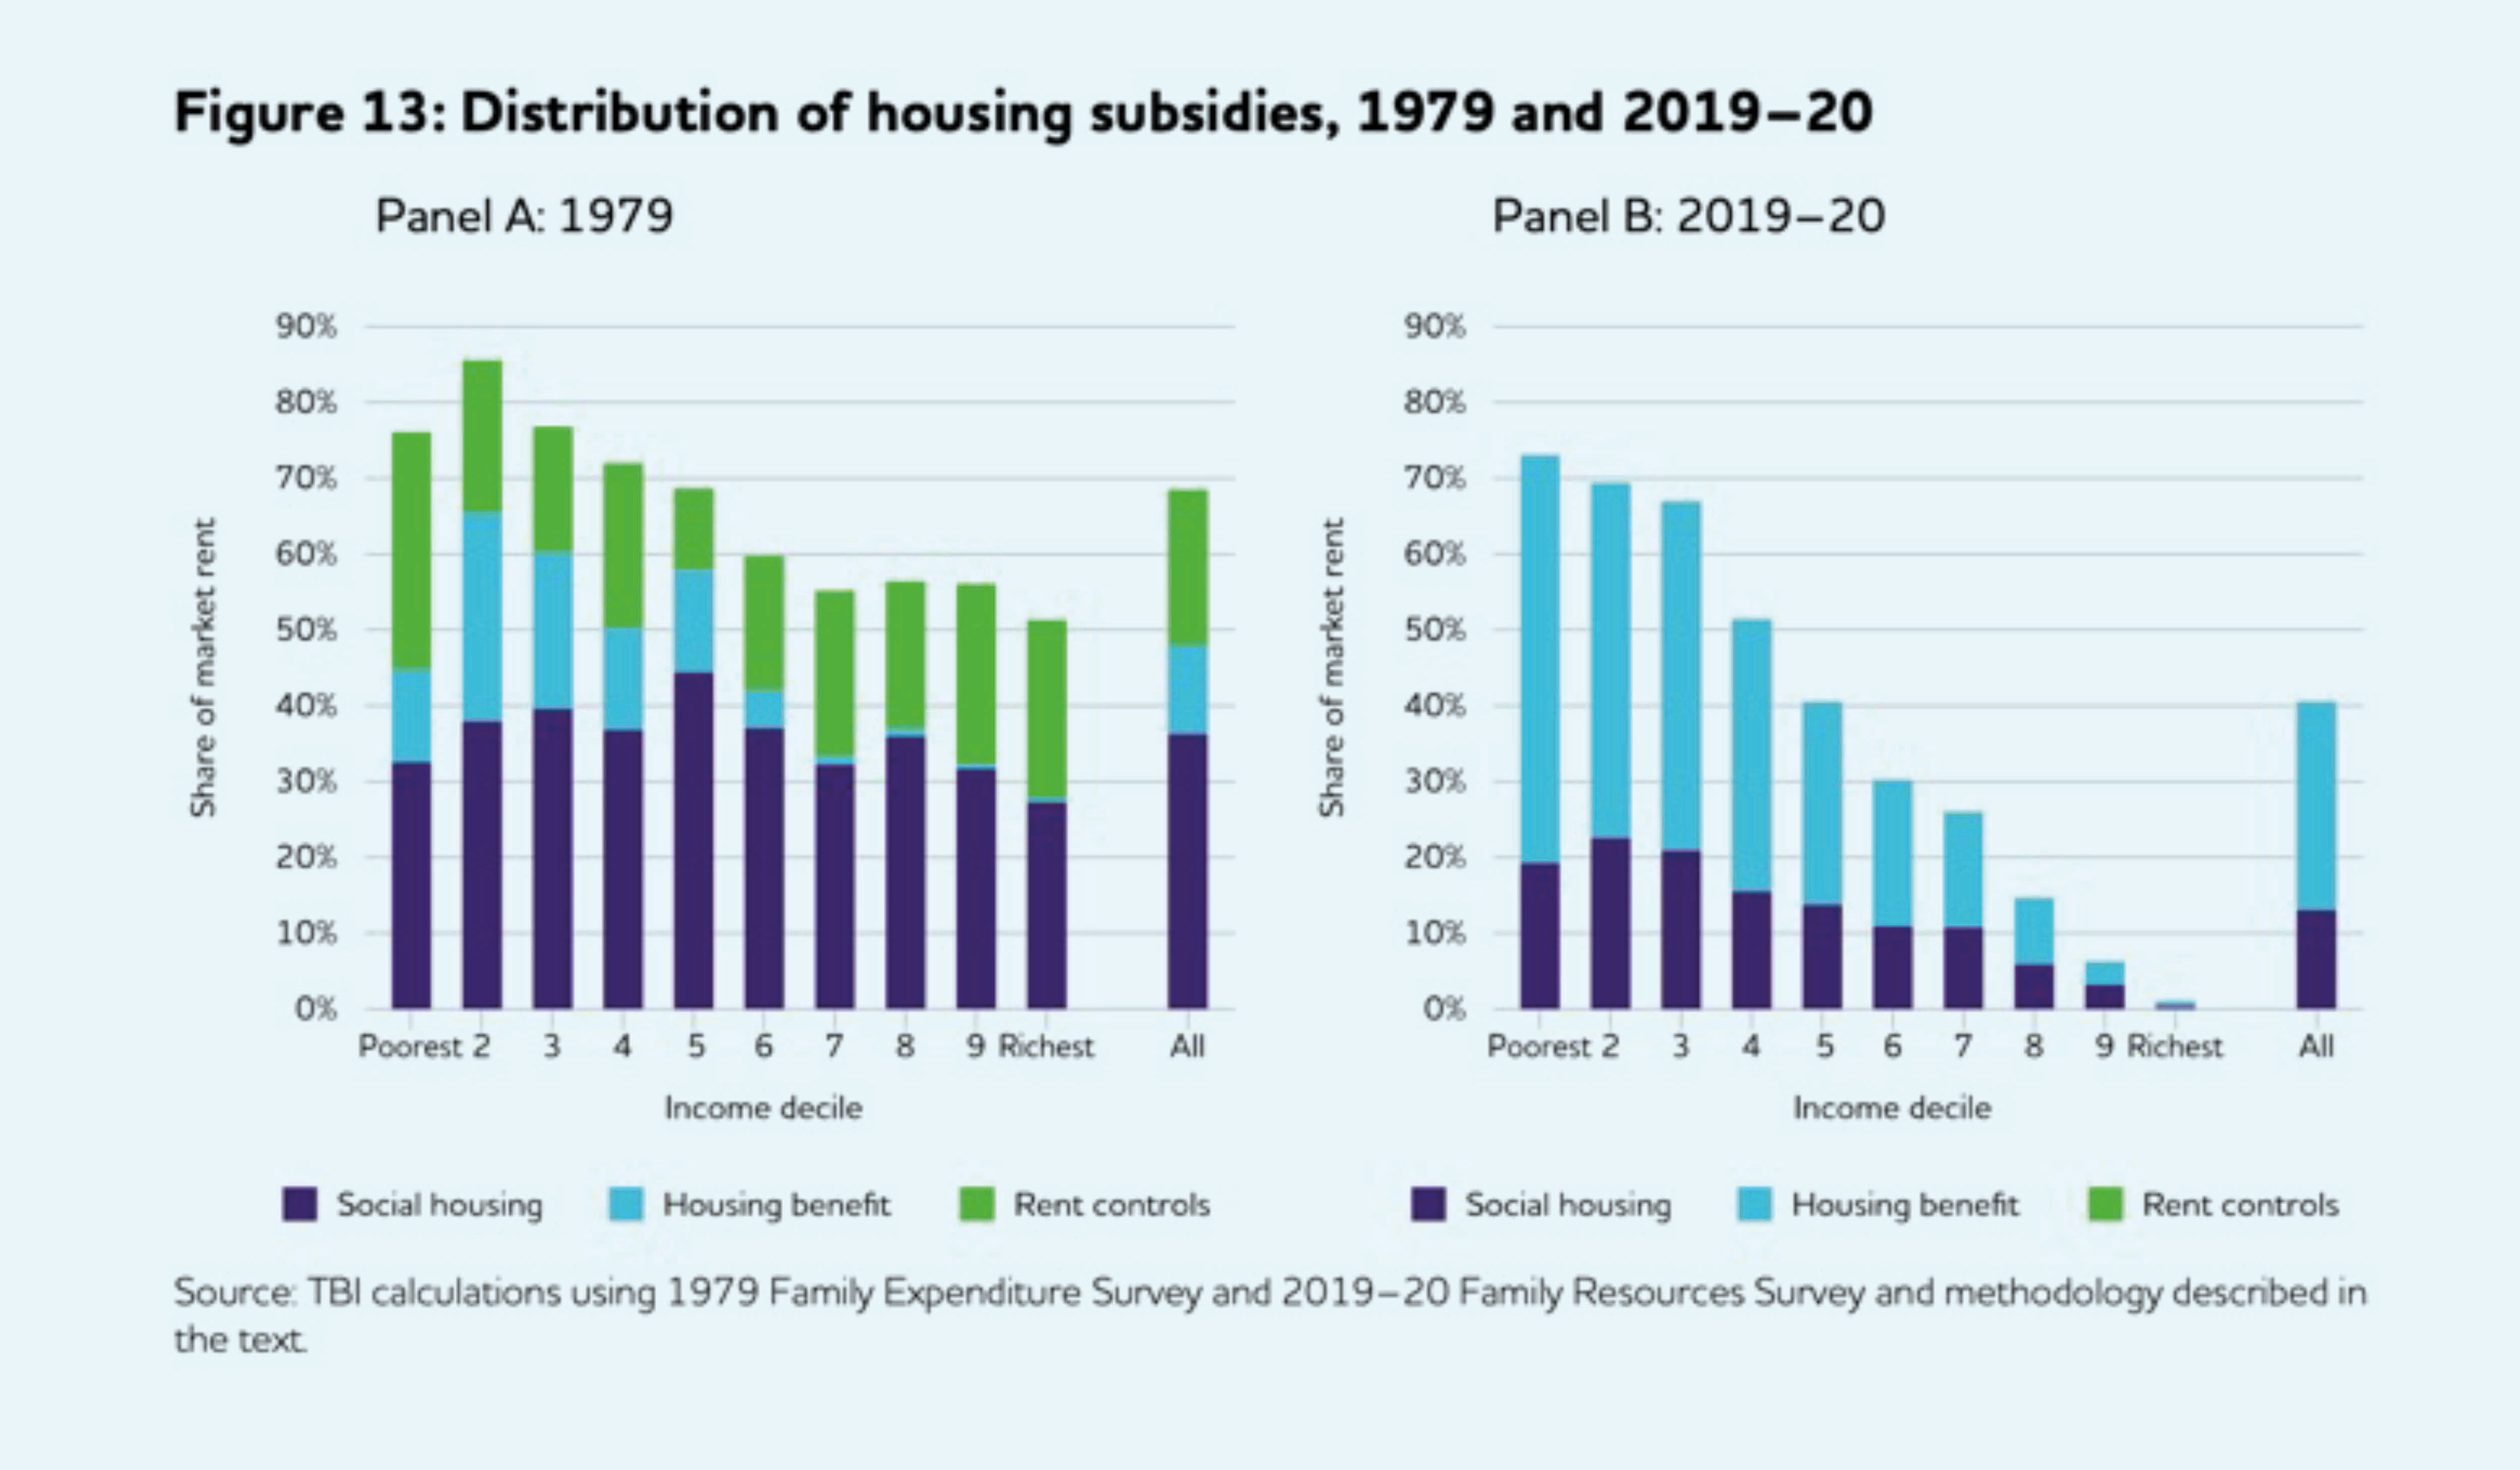
The impact has been felt across the income distribution. The next graph shows the change in the distribution of the three subsidies for renters in each income decile as a share of their market rent (see figure 13 below).
Elimination of subsidies
The elimination of subsidies for the richest households thanks to the end of rent controls and richer council tenants exercising the right to buy is striking; but the impact on lower income levels is just as stark.
As the authors point out: “A reduction in the subsidy received by the second income decile from 86% to 70% of the market rent represents a doubling in the housing costs they must pay out of their own pocket. This explains why housing has become significantly less affordable for lower-income groups over the past 40 years.”
Two conclusions flow from all of this. The first is that the squeeze on housing subsidies fully explains the deterioration in affordability for renters over the past 40 years and “that the crisis of housing affordability is one of redistribution, not a lack of anything”.
That’s important because it contradicts the case put forward by successive governments that an inadequate rate of new housing supply is to blame for pushing up the cost of housing.
If that will be controversial for those wedded to supply-side solutions, it was always unlikely that supply would increase by enough to materially improve affordability on its own.
Bear in mind too that the government has all but abandoned its target of 300,000 new homes a year by the mid-2020s in response to the Tory backbench rebellion on planning, and that house builders are already scaling back in response to the housing market slowdown.
The second conclusion flows directly from the first: if the fall in subsidies is to blame then “there is no credible route to significantly improving affordability that does not involve rebuilding some of these support systems”.
So what is the best mix for housing subsidy? The report rejects fresh rent controls since they would recreate many of the problems they caused (such as reduced private rental supply and quality), but argue strongly for more social housing and more generous housing benefit.
And it argues that tenure stability, work incentives, tenant choice and taxpayer cost should be considered in subsidy design. For lower-income families with children and many disabled people and pensioners, for example, stability is key and social housing most appropriate.
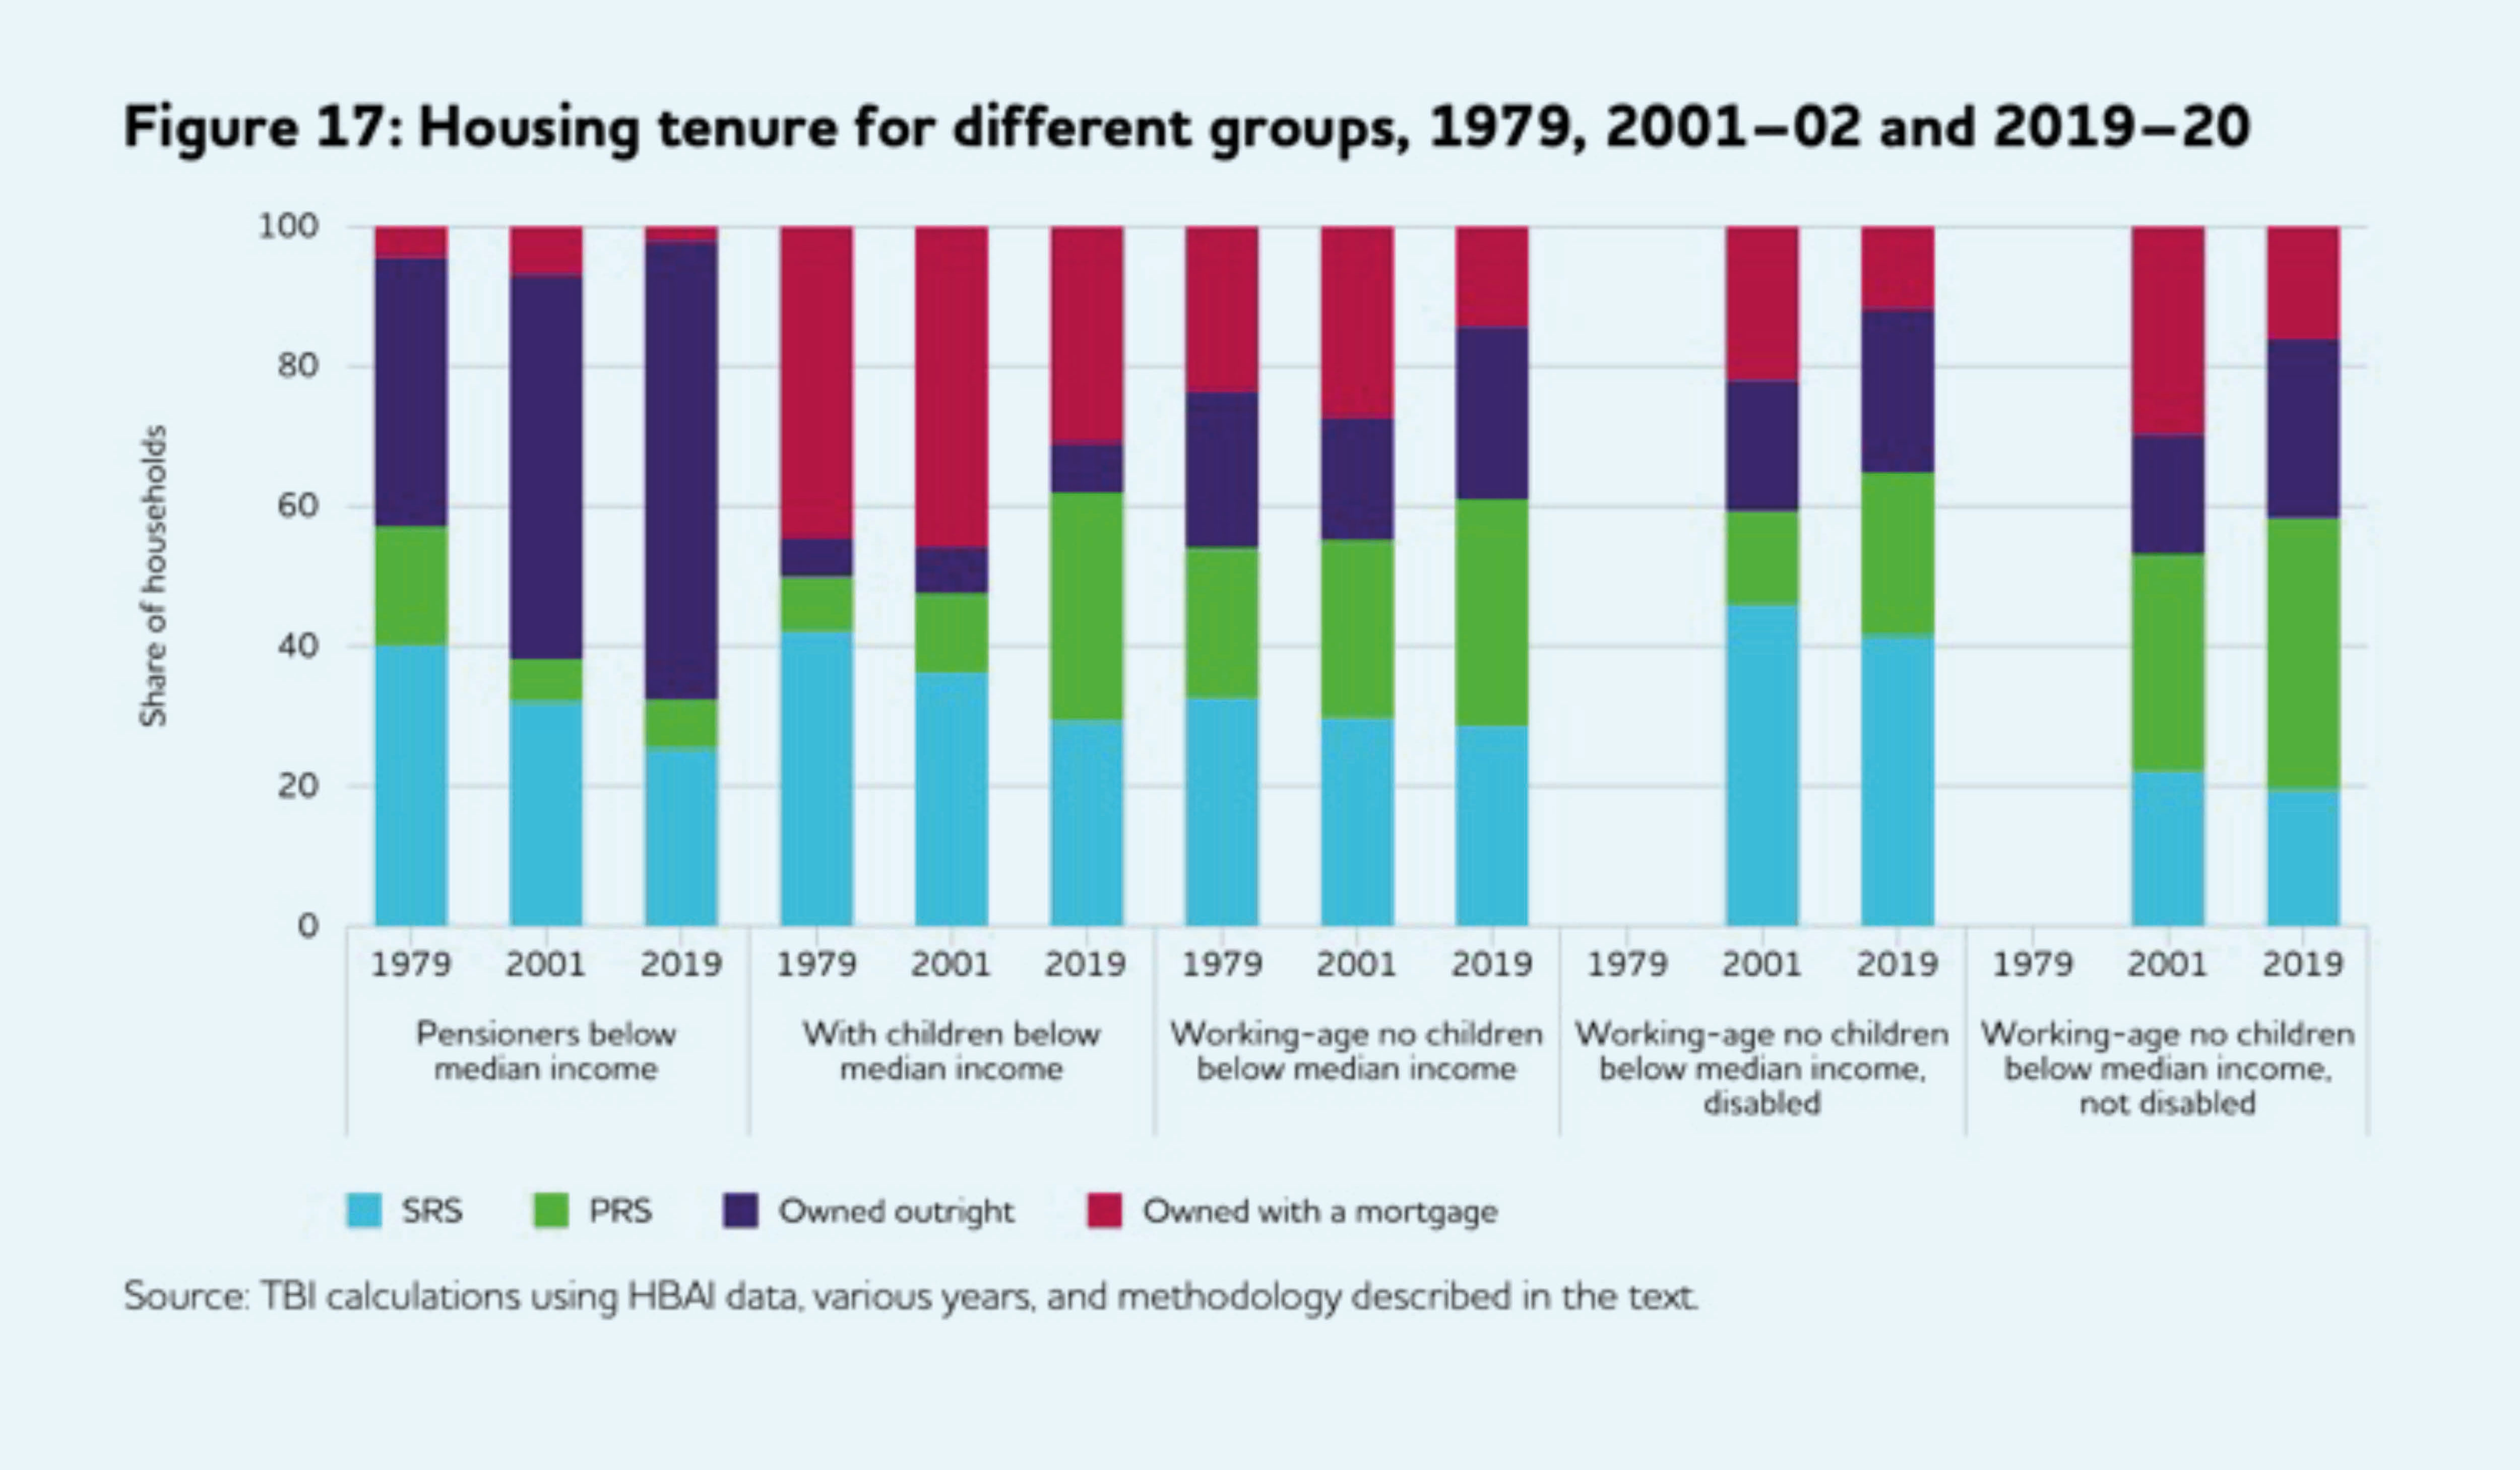
Our current system does not remotely deliver that. Figure 17 below shows the changing tenure of the lower-income half of households since 1979.
Stability of social housing
For some, like pensioners, the growth in homeownership has been marked but the share of working-age households with children below median income who are renting privately has risen from one in 10 to one in three as homeownership and social renting have declined.
The report calculates 1.9 million households in the private rented sector would benefit from the stability of social housing.
An extra 500,000 social homes would be needed to get back to 1979 levels of social renting among lower-income families with children, with 225,000 more social homes required to bring the share of working-age disabled people in private rented homes below 10%.
The authors view social housing as the cheapest way to provide housing services and the best way to enhance work incentives, although admit other considerations “put limits on its appropriate scale”.
Meanwhile, housing benefit can help households for whom choice and labour mobility make them better suited to private renting – but only with reforms to reverse cuts made since 2010 and introduce the “fairer private rented sector” promised in last year’s eponymous white paper.
Clearly few people reading this column will disagree with a report calling for more social housing and more generous housing benefit. What makes this one different, I think, is that it is argued as much on economic grounds as it is on the social grounds more familiar from other studies of housing need.
What the report omits is to quantify the Treasury costs and benefits of a large increase in subsidy, or of the implicit switch from benefits to bricks – cost-cutting was the raison d’etre of subsidy cuts, while the mention of 700,000 new social homes will be enough to cause apoplexy in Whitehall.
But it is such thinking over the past 40 years that has led us to our country’s unaffordable homes, rising poverty and failed housing system.
If not by deliberate design – as the report points out, the plan in the late-1980s was to improve rental supply for young people and job movers, not for the private rented sector to become home to so many families with children – it is the result of many individual decisions based on value for money that led to exactly the opposite.
Jules Birch, columnist, Inside Housing
Sign up for our daily newsletter
Already have an account? Click here to manage your newsletters


